
Yearn.Finance (YFI) reached a new all-time high price, on May 12.
COTI (COTI) is currently attempting to break out from a descending resistance line.
Alpha Finance Lab (ALPHA) has broken out from a descending resistance line and is in the process of moving above the $2.20 resistance area.
Yearn.Finance (YFI)
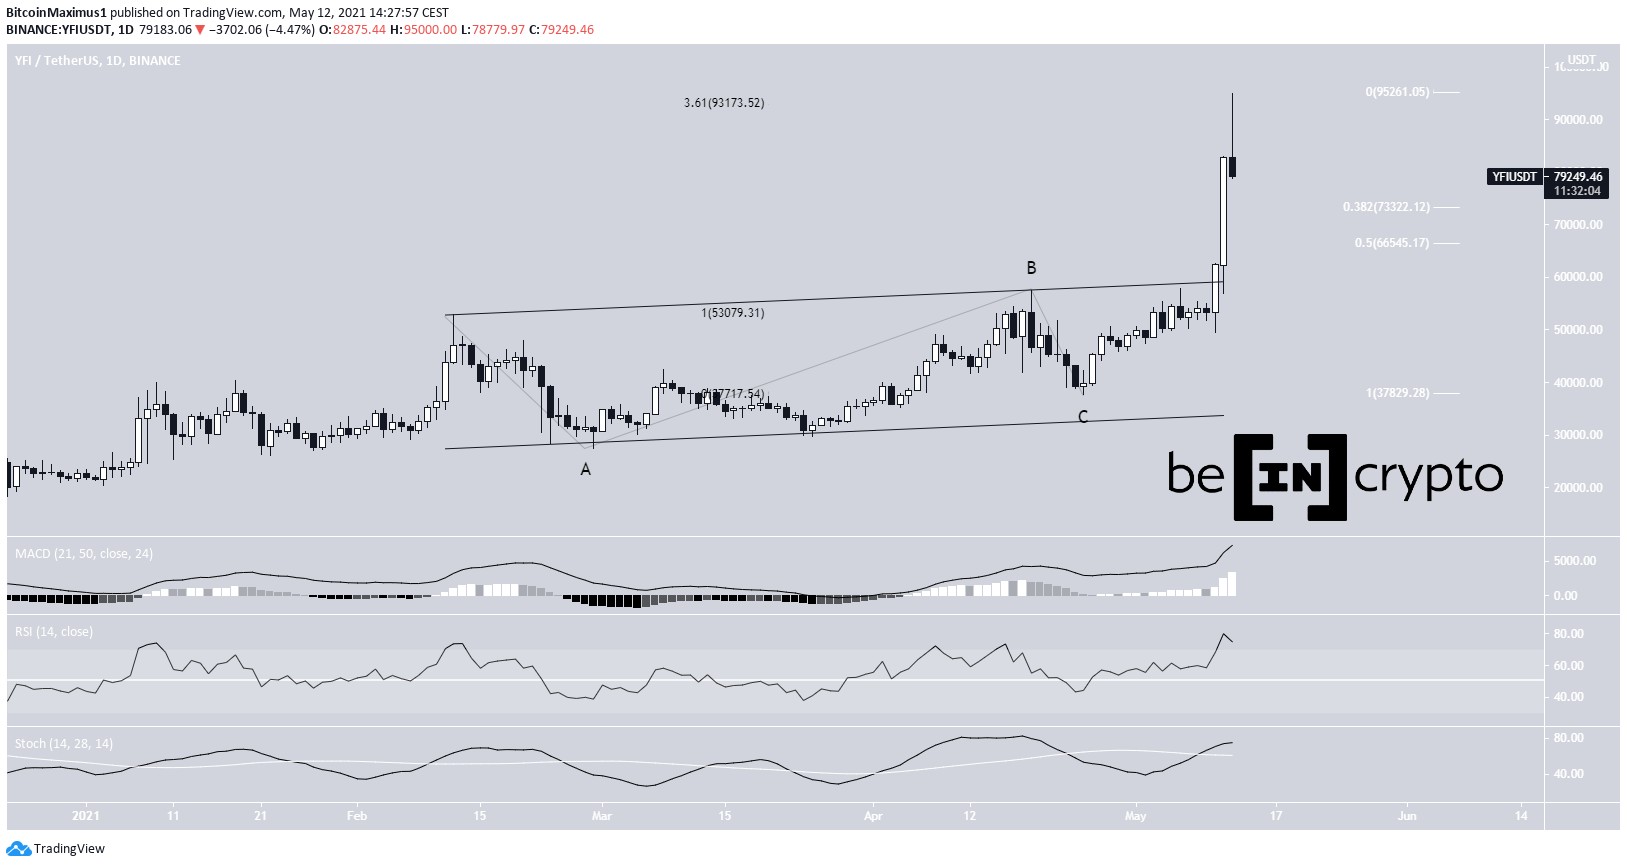
SponsoredYFI had been trading inside an ascending parallel channel since Feb. 12. Inside it, it completed a running flat correction, whose truncated bottom was reached on April 15.
On May 10, it managed to break out from this channel, doing so with significant strength. It managed to reach a new all-time high price of $95,000 on May 12. The high was made right at the 3.61 external Fib retracement resistance level (black).
Despite technical indicators being bullish, YFI is in the process of creating a shooting star candlestick in the daily time-frame.
Therefore, it is possible that the token will decrease towards the closest support levels at $73,300 and $66,500 (white), before potentially making another upward movement.
Highlights
- YFI reached a new all-time high price, on May 12.
- It could create a shooting star candlestick.
COTI (COTI)
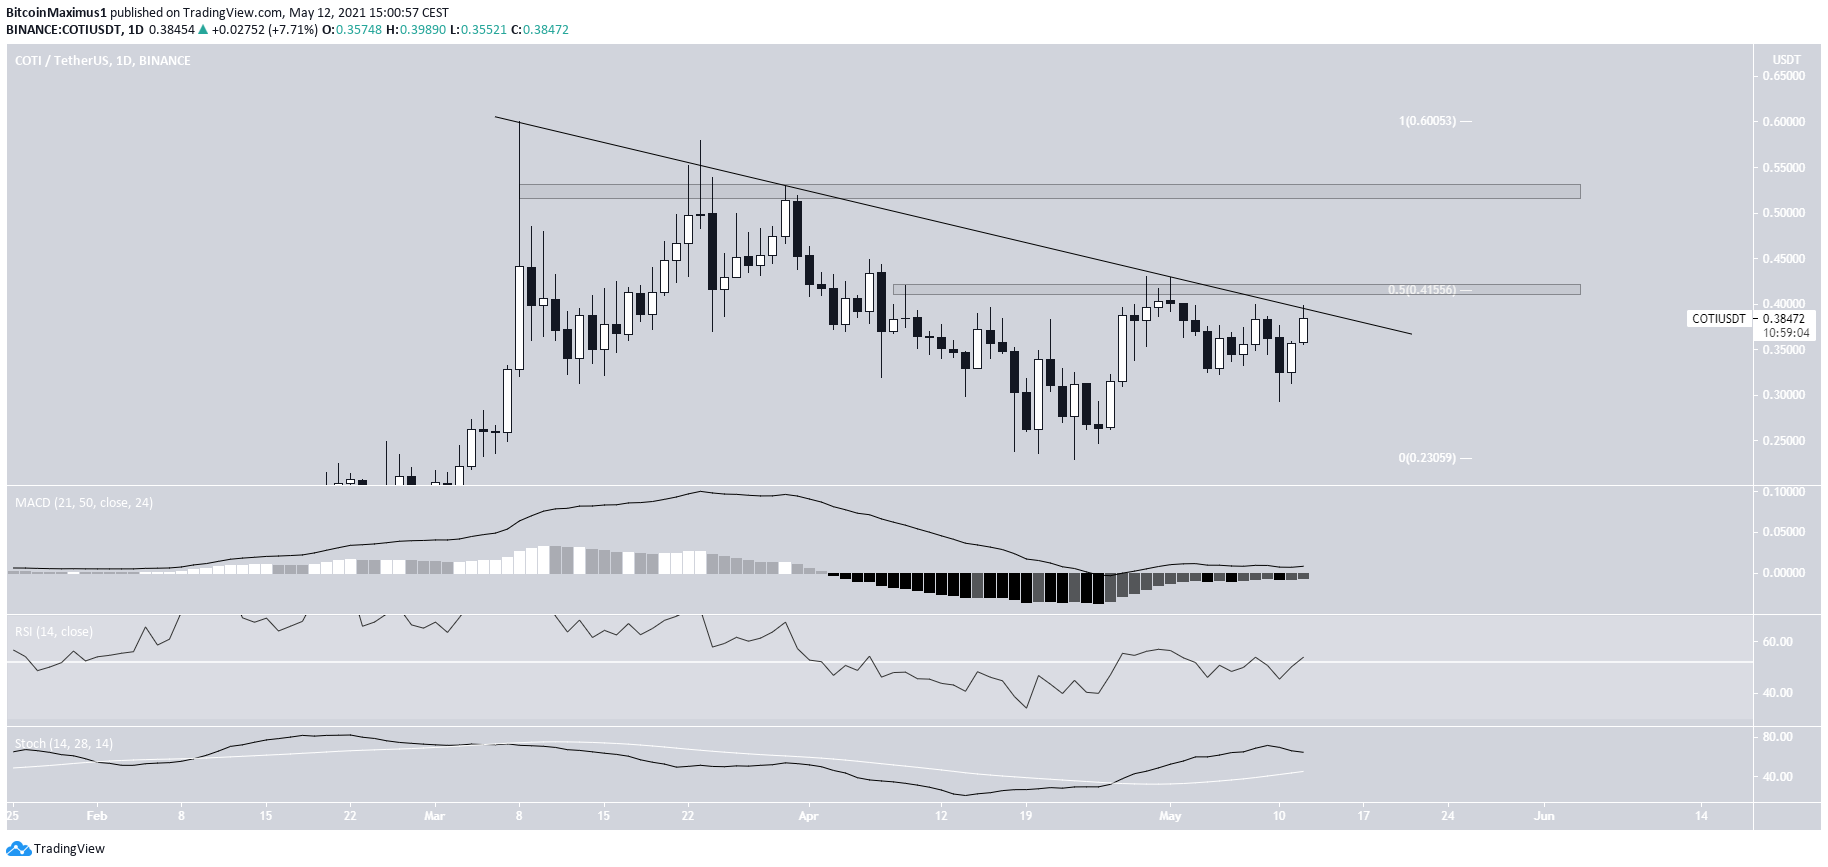
COTI has been following a descending resistance line since March 8, when it had reached an all-time high price of $0.6.
Currently, it is making its fifth breakout attempt.
The descending resistance line coincides with the $0.415 resistance area. Afterwards, the next closest resistance is found at $0.52, just below the all-time high price.
Technical indicators are bullish, supporting the possibility that COTI breaks out.
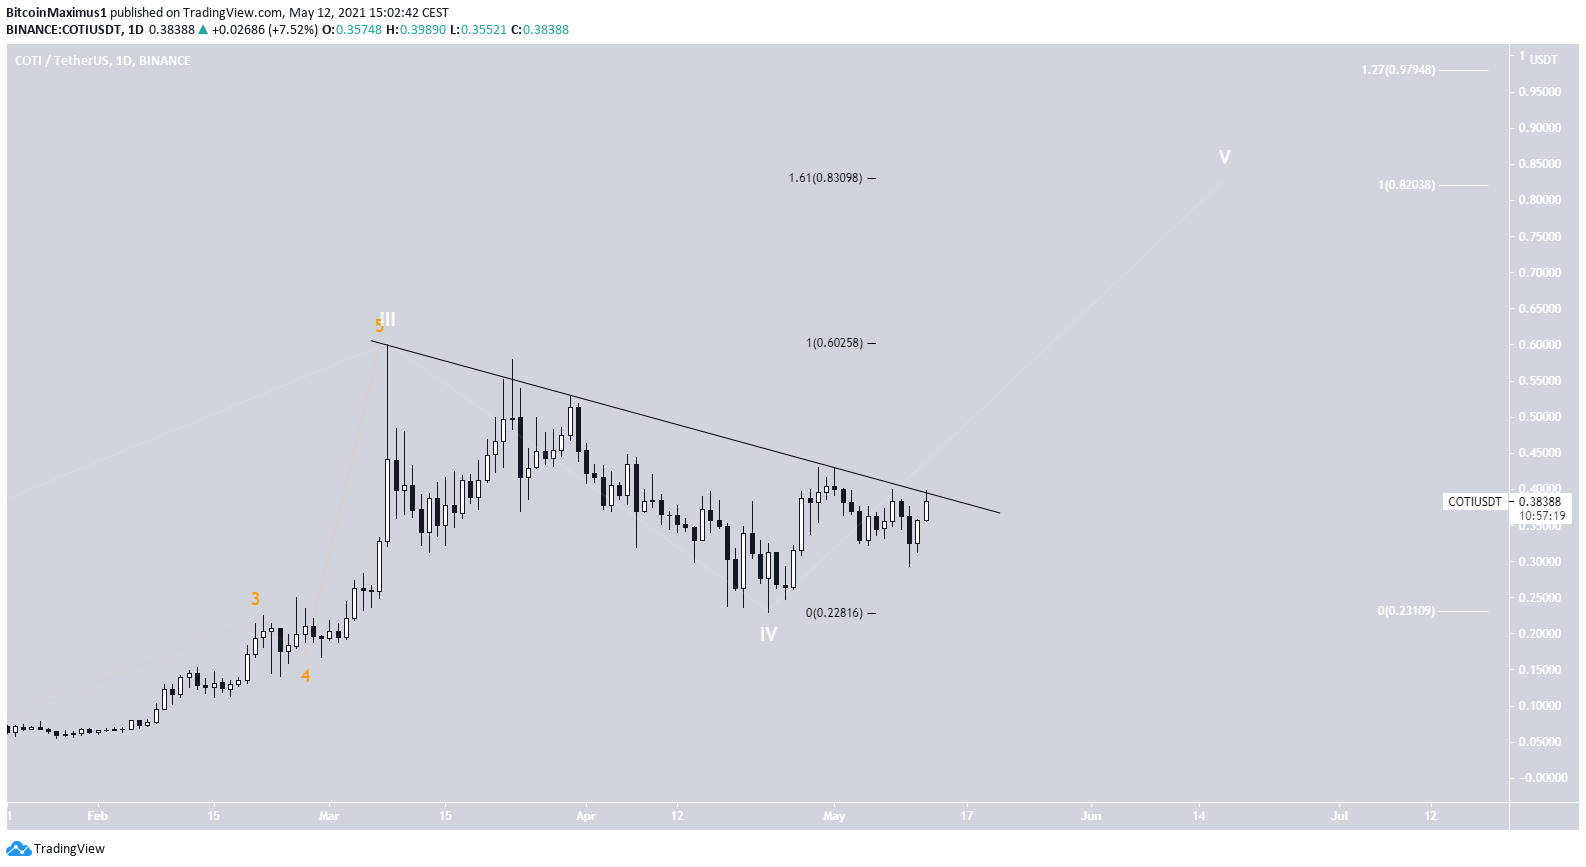
The wave count indicates that COTI is in wave five of a bullish impulse (white).
SponsoredA likely target for the top of the movement is located between $0.82 and $0.83. The target is found using a Fib projection on waves 1-3 (white) and an external Fib retracement on wave four (black).
Highlights
- COTI is following a descending resistance line.
- It has likely begun wave five of a bullish impulse.
Alpha Finance Lab (ALPHA)
ALPHA had been following a descending resistance line since reaching a high of $2.94, on Feb. 5.
Sponsored SponsoredAfter three unsuccessful attempts, it managed to break out on April 30. Afterwards, it returned to validate the line as support on May 10.
Technical indicators are bullish, providing legitimacy to the breakout. This is especially visible by the RSI cross above 50.
ALPHA is currently attempting to break out from the $2.17 resistance area. If successful, the next closest resistance would be found at the $2.94 highs.
Sponsored Sponsored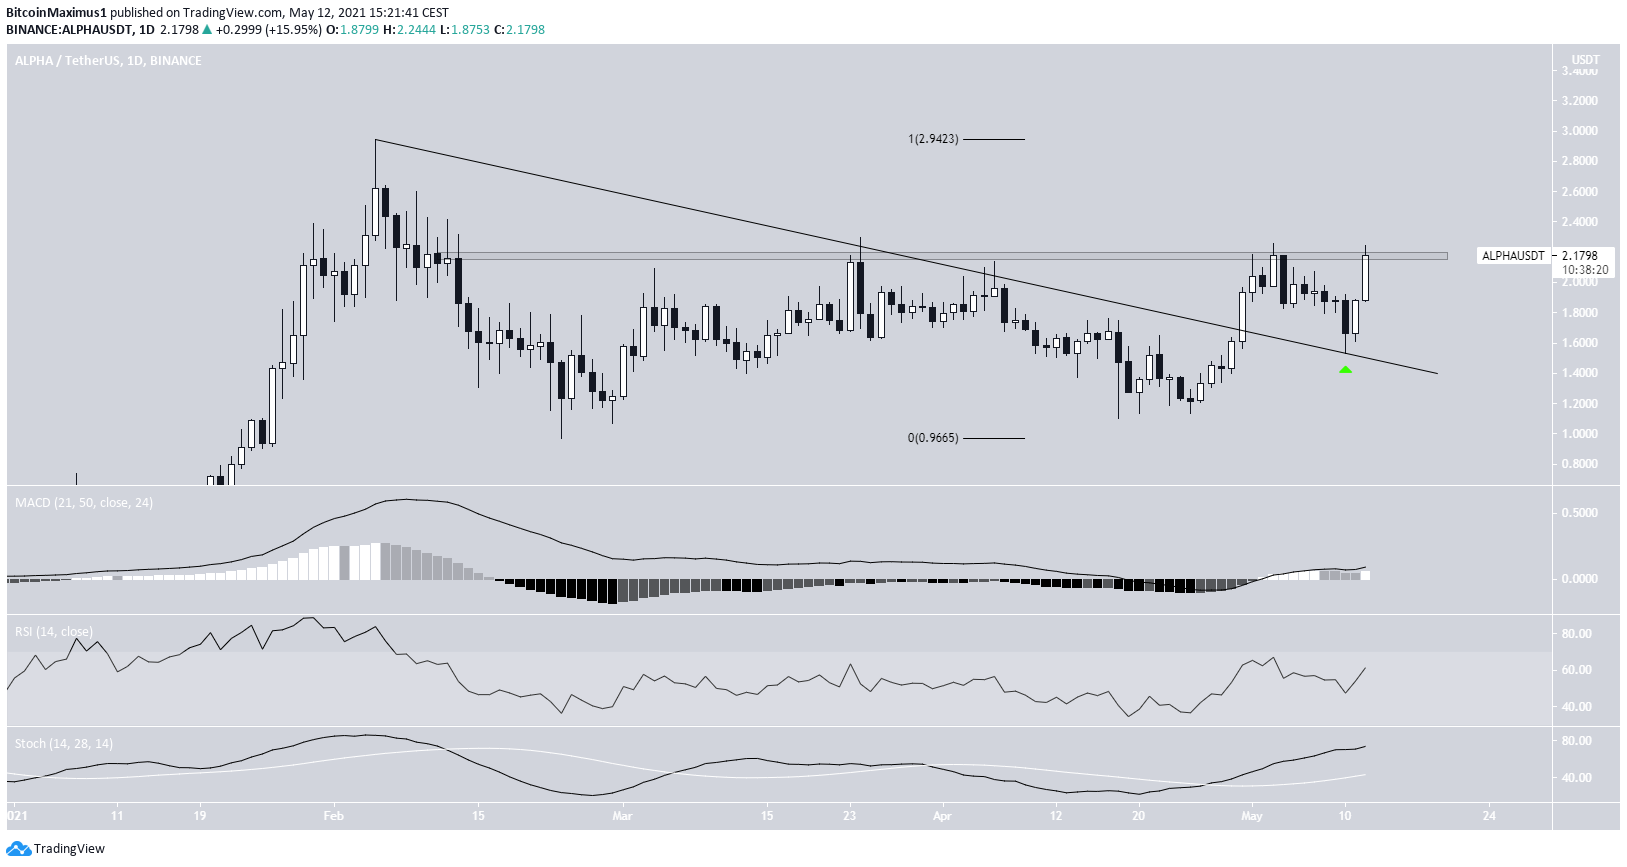
Highlights
- ALPHA has broken out from a descending resistance line.
- It is facing resistance at $2.17.
For BeInCrypto’s latest bitcoin (BTC) analysis, click here.
