Yearn.Finance (YFI) is showing strong bullish signs after bouncing from its Dec lows. However, it has to break out from the current pattern in order to confirm the bullish reversal.
YFI had been trading above the $27,200 horizontal support area since the beginning of May. In addition to this, it has been increasing alongside an ascending support line.
It broke down from the line on Nov 28 (red circle) and proceeded to reach a low of $17,699 on Dec 4.
SponsoredHowever, YFI initiated a rapid upward movement on Dec 15 and reclaimed both the $27,200 area and the ascending support line the next day. This is a decisive bullish sign, since it renders the previous breakout as a deviation only.
Technical indicators are also bullish, supporting the continuation of the upward movement.
The MACD has crossed into positive territory. This is a staple of bullish trends, since it means that the short-term trend is faster than the long-term one.
The RSI has crossed above 50. This is also a sign of bullish momentum.
Therefore, the daily time-frame suggests that the trend is bullish and YFI will continue increasing.
Sponsored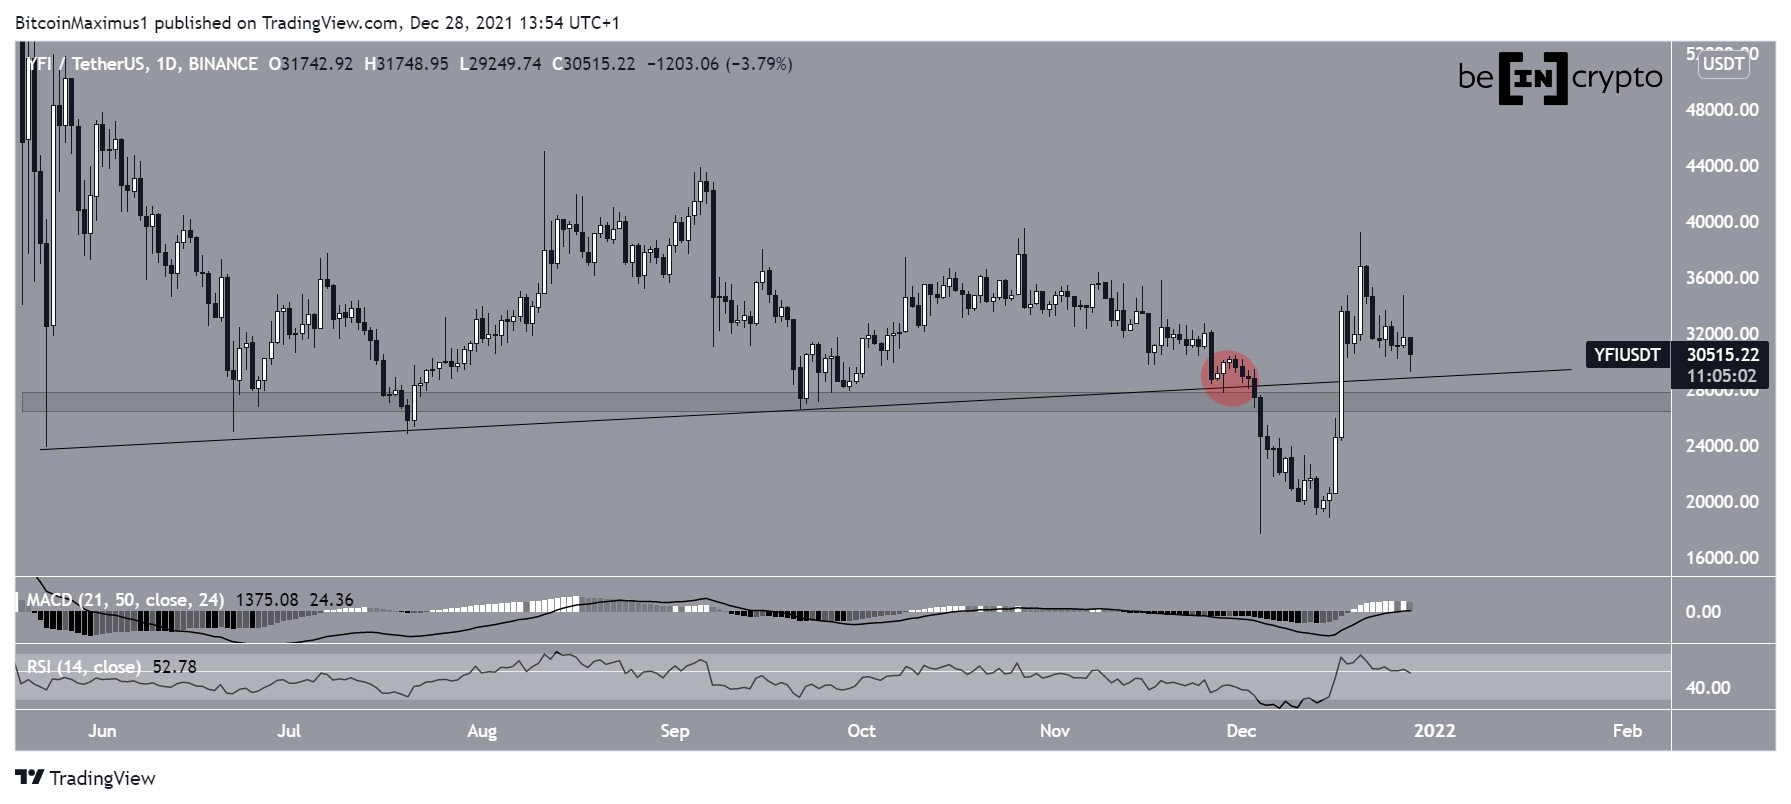
Short-term movement
The 12-hour chart shows that YFI is currently trading very close to the resistance line of a descending parallel channel. Such channel usually contain corrective movements, meaning that a breakout form it would be likely.
YFI has to continue consolidating above the middle of the channel in order for the breakout to become more likely.
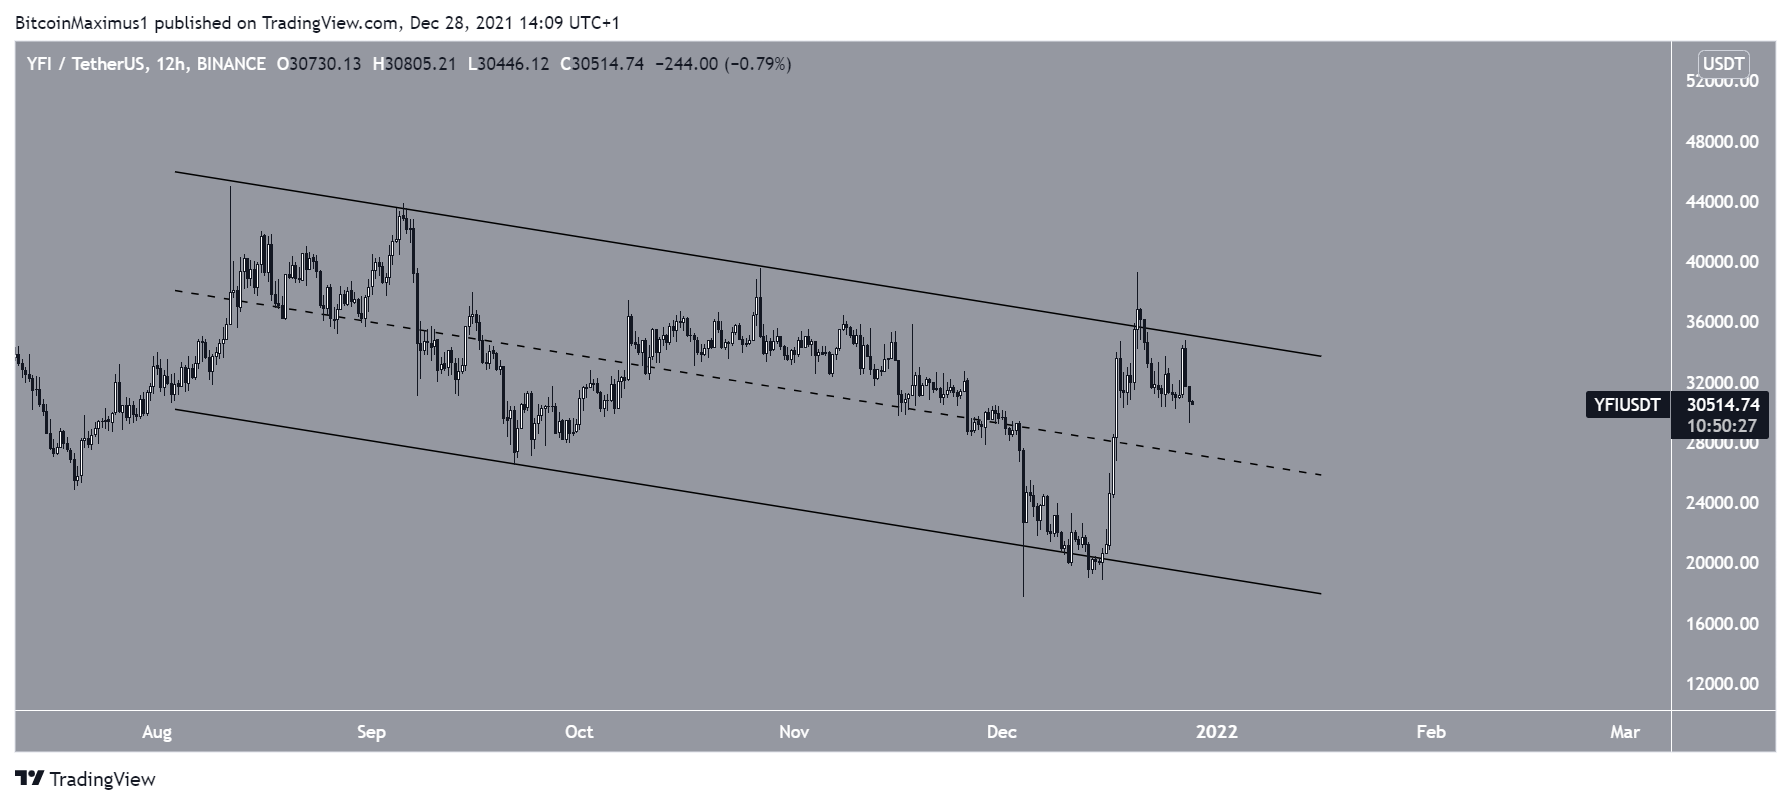
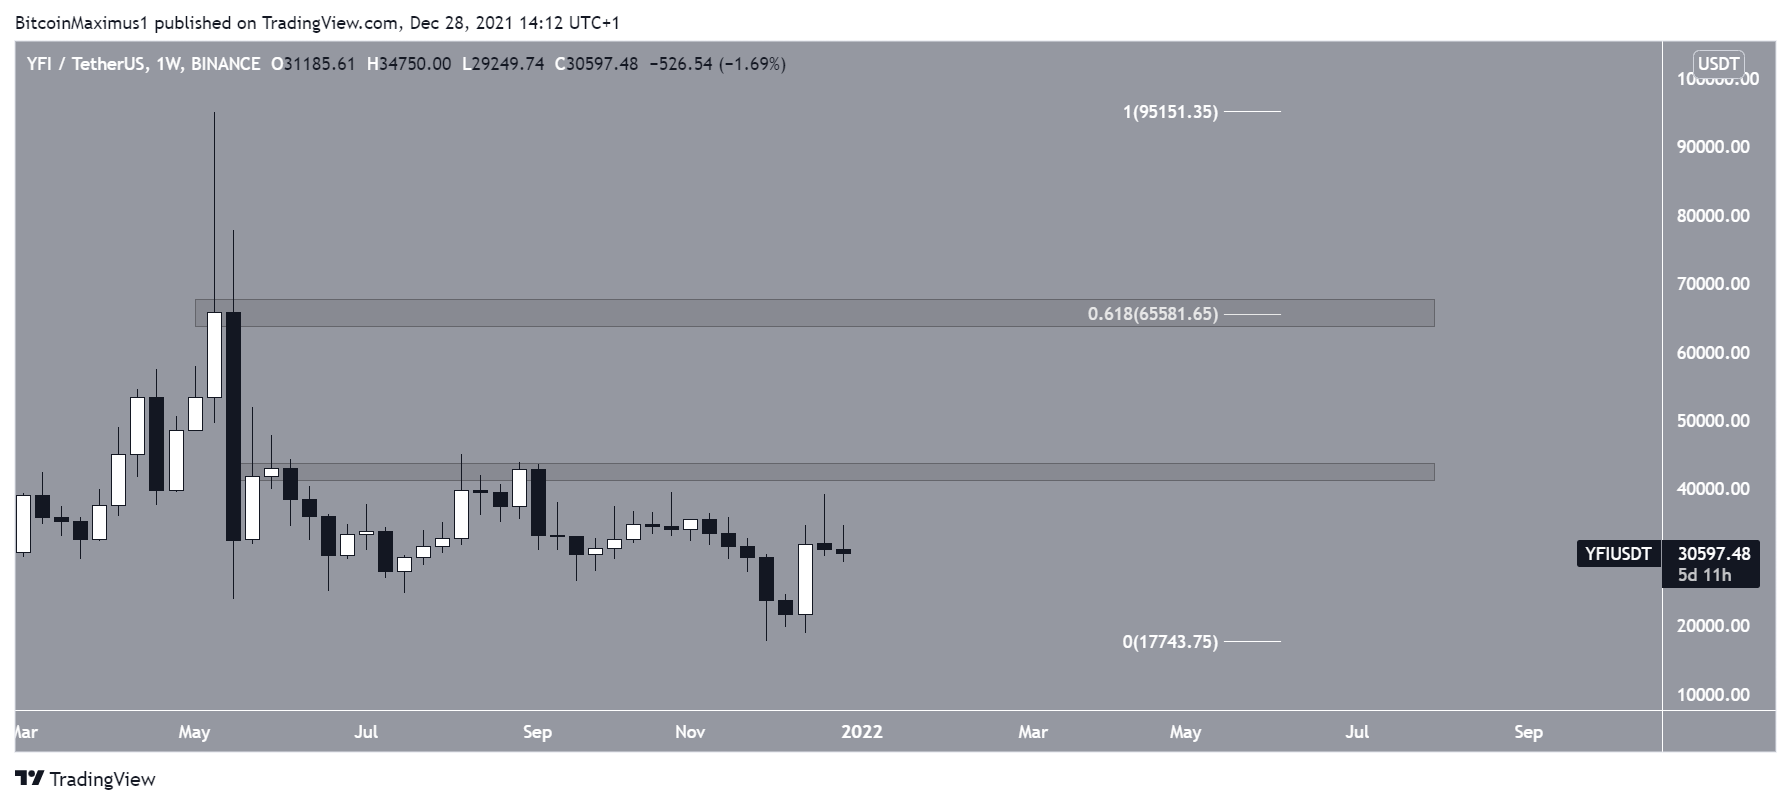
If a breakout from the channel occurs, the closest resistance area would be at $43,000, followed by resistance at $65,750. The latter coincides with the closing price of the May all-time high and the 0.618 Fib retracement area. Therefore, it is a crucial level.
YFI/BTC
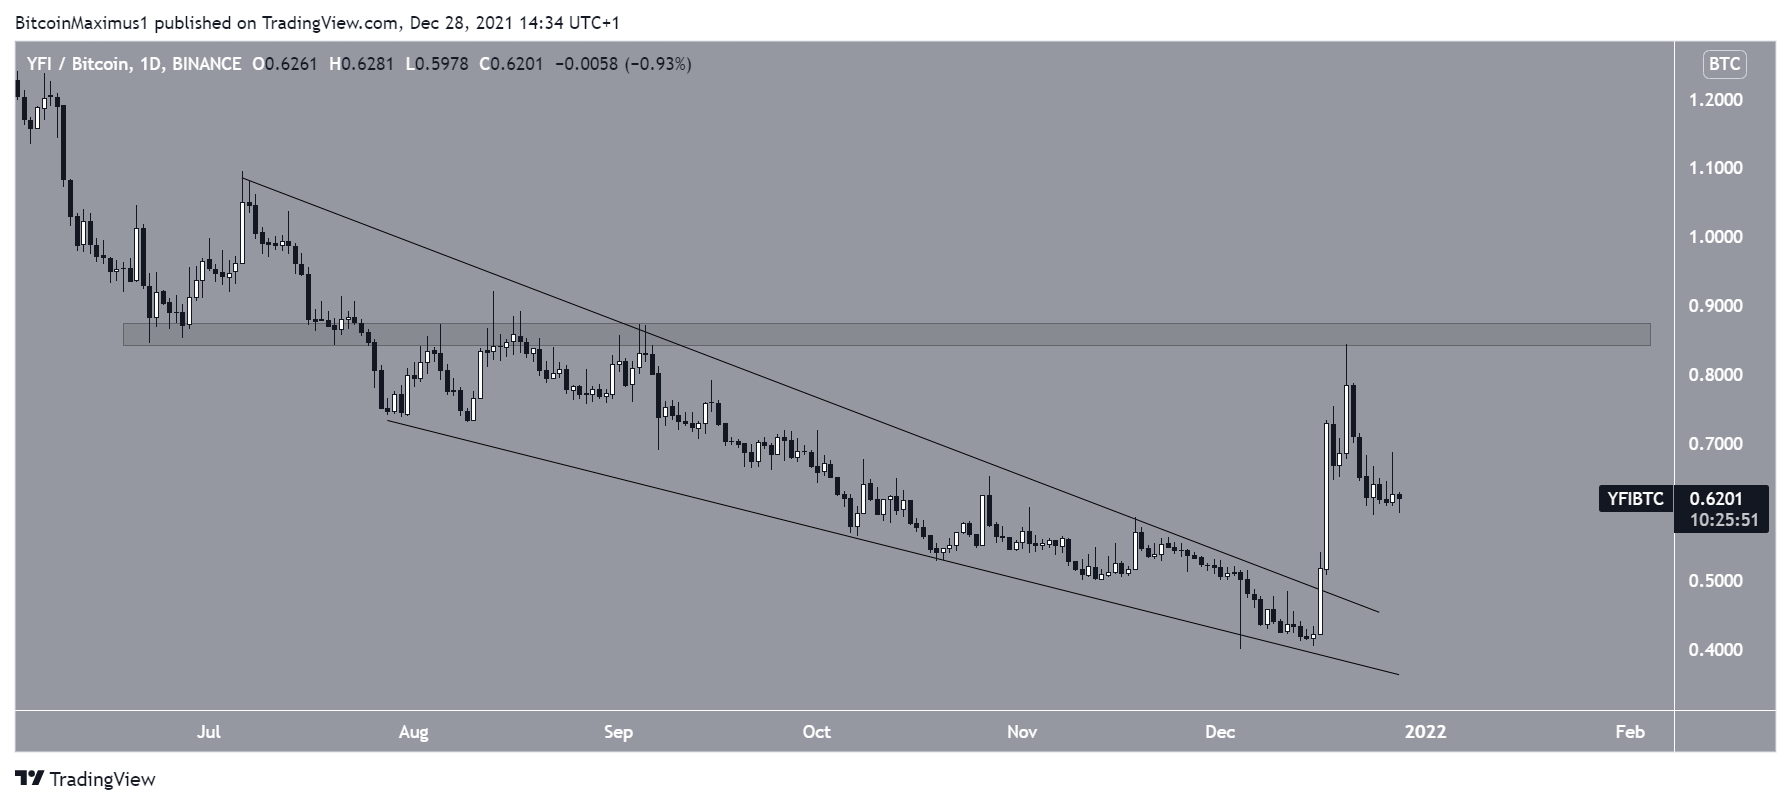
Cryptocurrency trader @CryptoNTez outlined an YFI chart, stating that the token has increased by 100% since the Dec lows.
Sponsored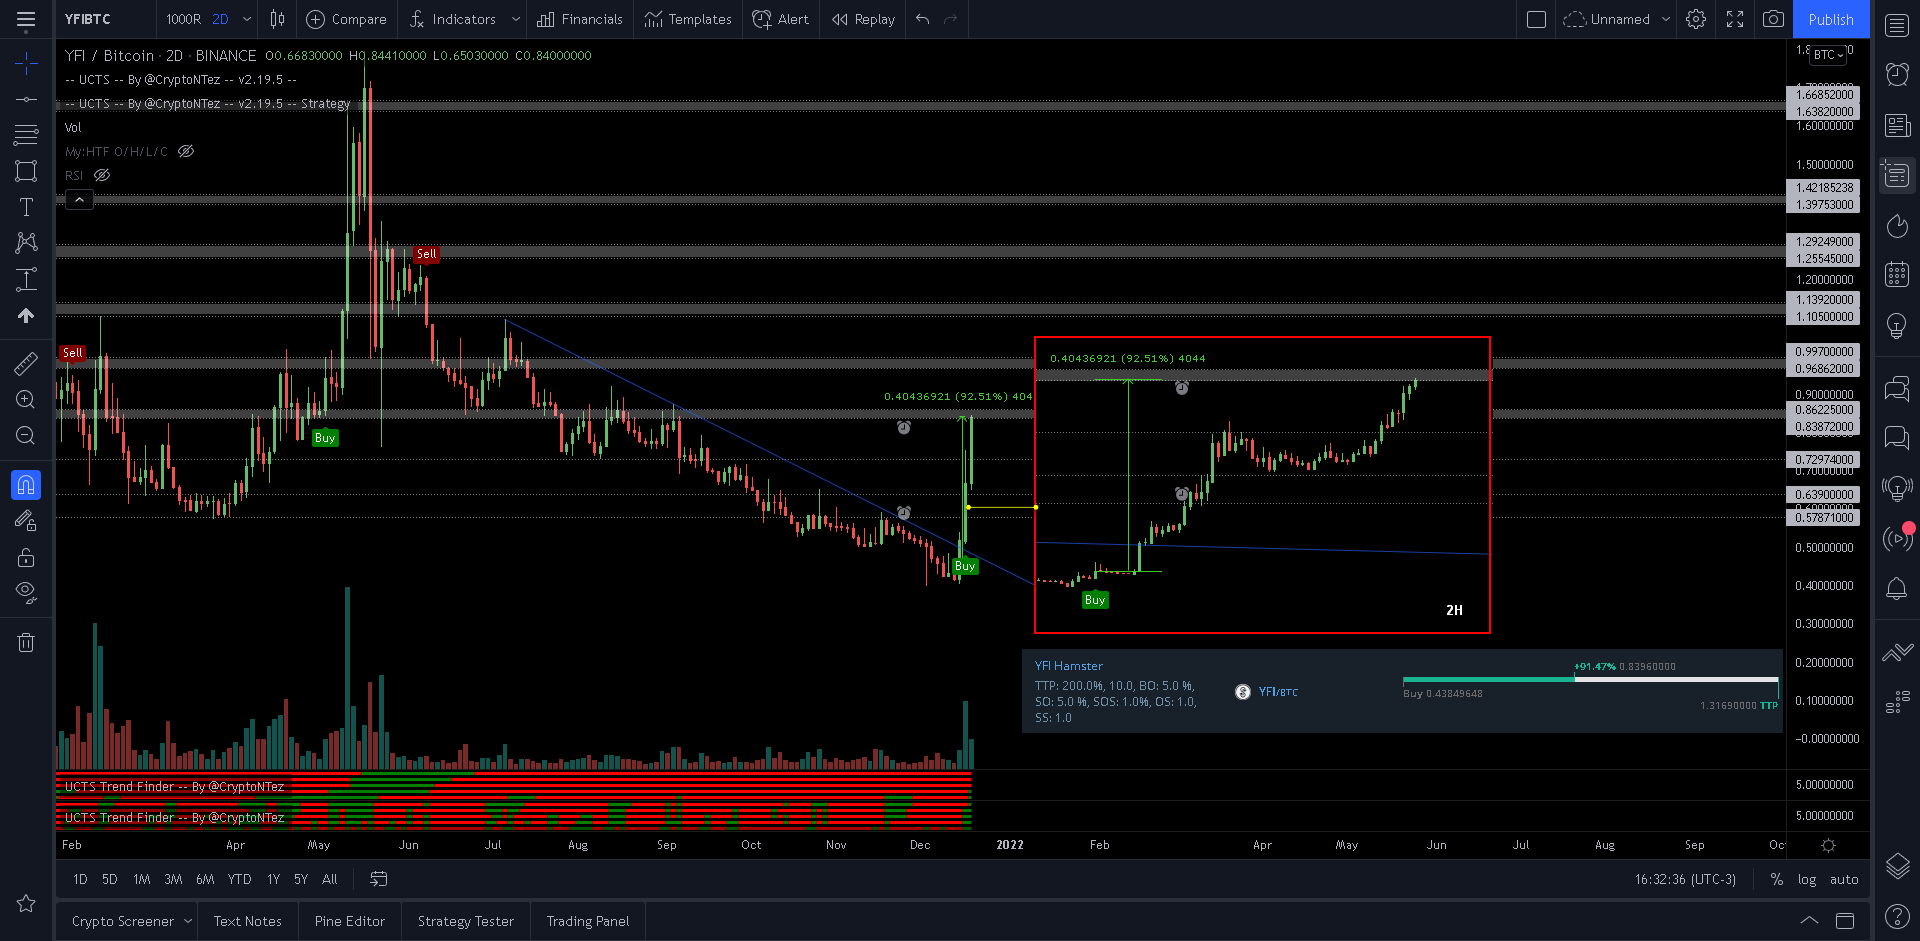
The YFI/BTC chart is also bullish, since it shows that the token has broken out from a descending wedge. It did so on Dec 16 and proceeded to reach a high of ₿0.84 three days later.
SponsoredThere is strong resistance at ₿0.86. If YFI/BTC were to clear this level, the rate of increase would be expected to accelerate.