
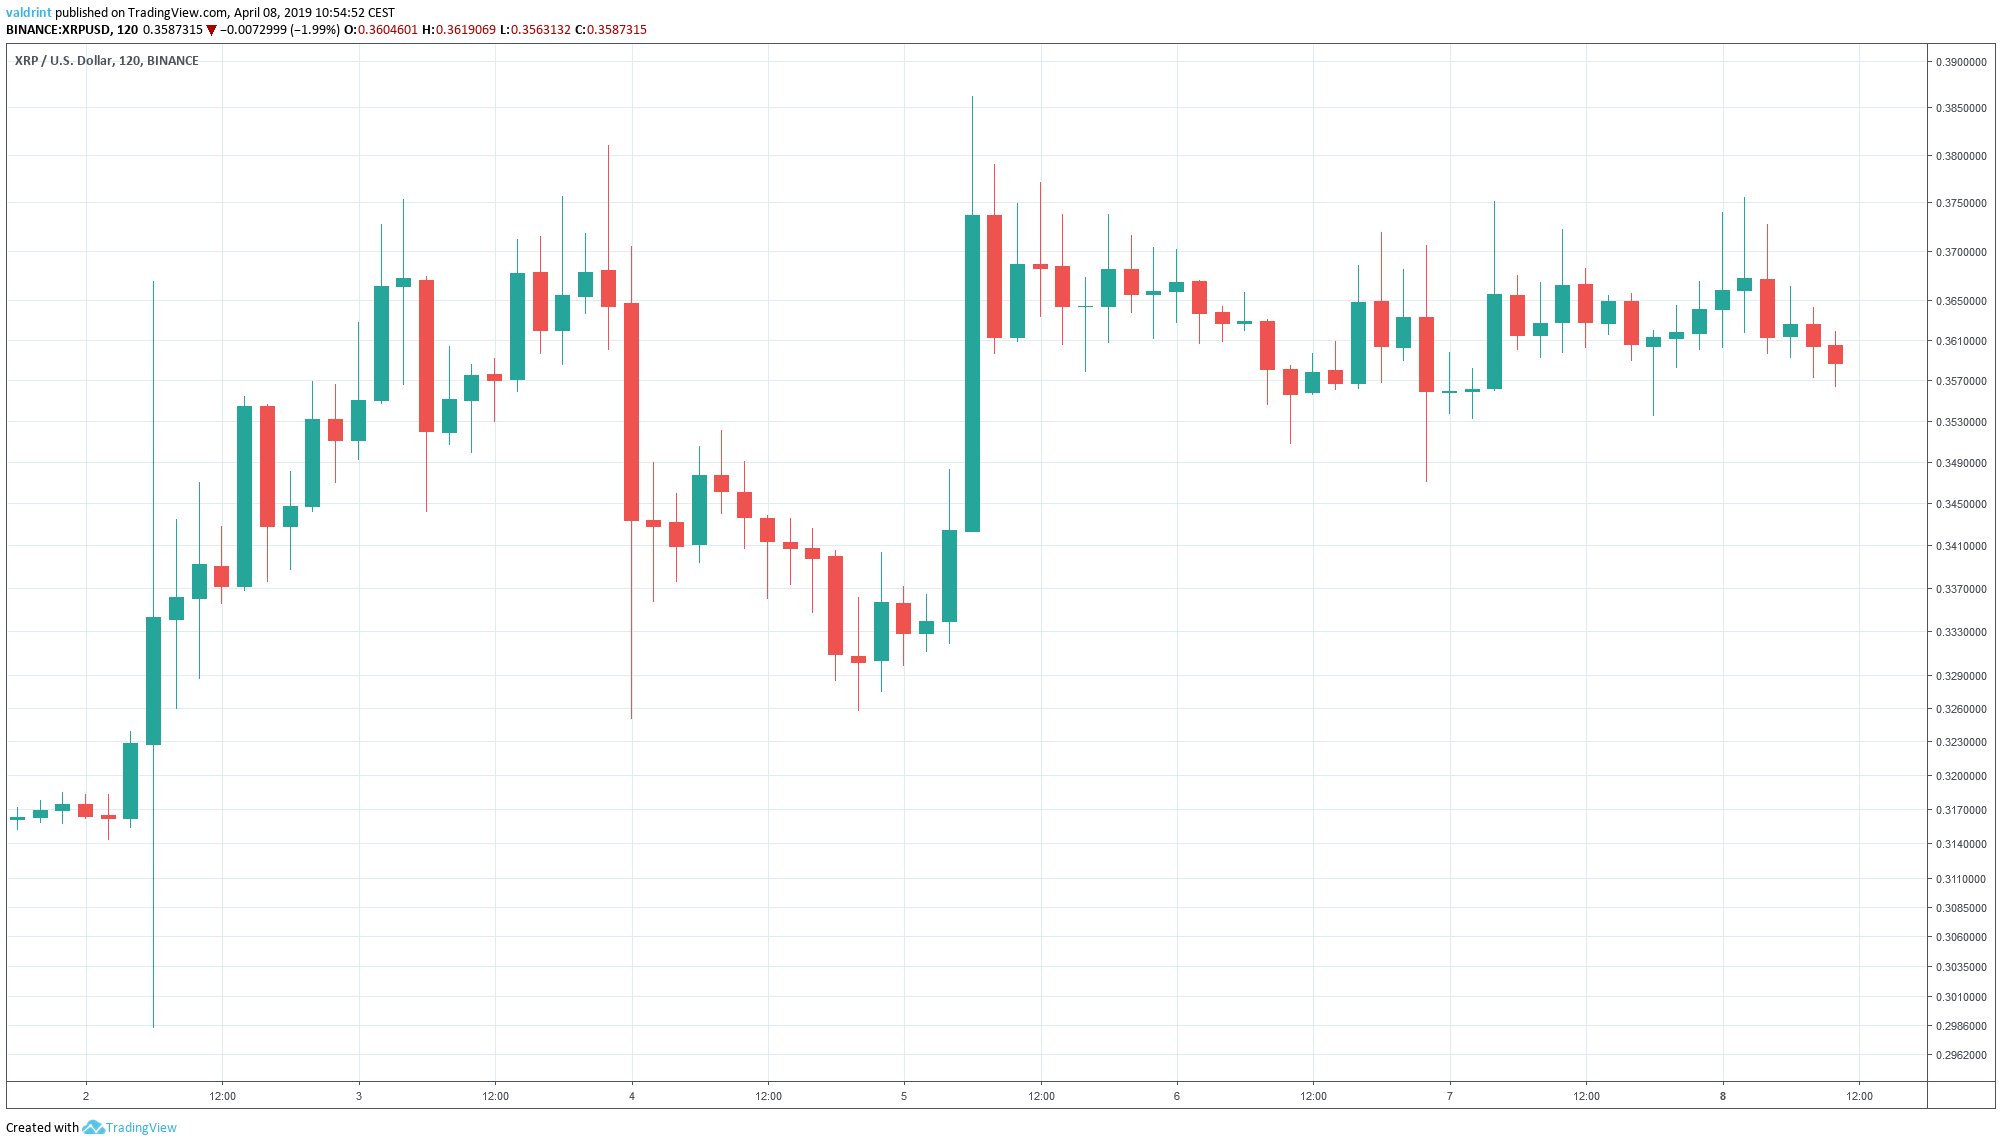
On Apr 3, XRP reached a high of just under $0.38. A rapid decrease created lows under $0.32 the following day.
Prices spiked again on Apr 5 and reached a high over $0.38. A slight decrease followed with XRP consistently struggling to maintain $0.35.
Over the last few days, XRP has faced little volatility:
Will XRP continue trading around $0.35 or will a decisive movement happen soon? If so, will prices go up or down?
Let’s find out:
XRP (XRP): Highlights and Trends For April 8, 2019
- The price of XRP/USD has been on an uptrend since Apr 2.
- It is trading inside a horizontal channel.
- Bearish divergence developing in the RSI and the MACD.
- There is support near $0.345
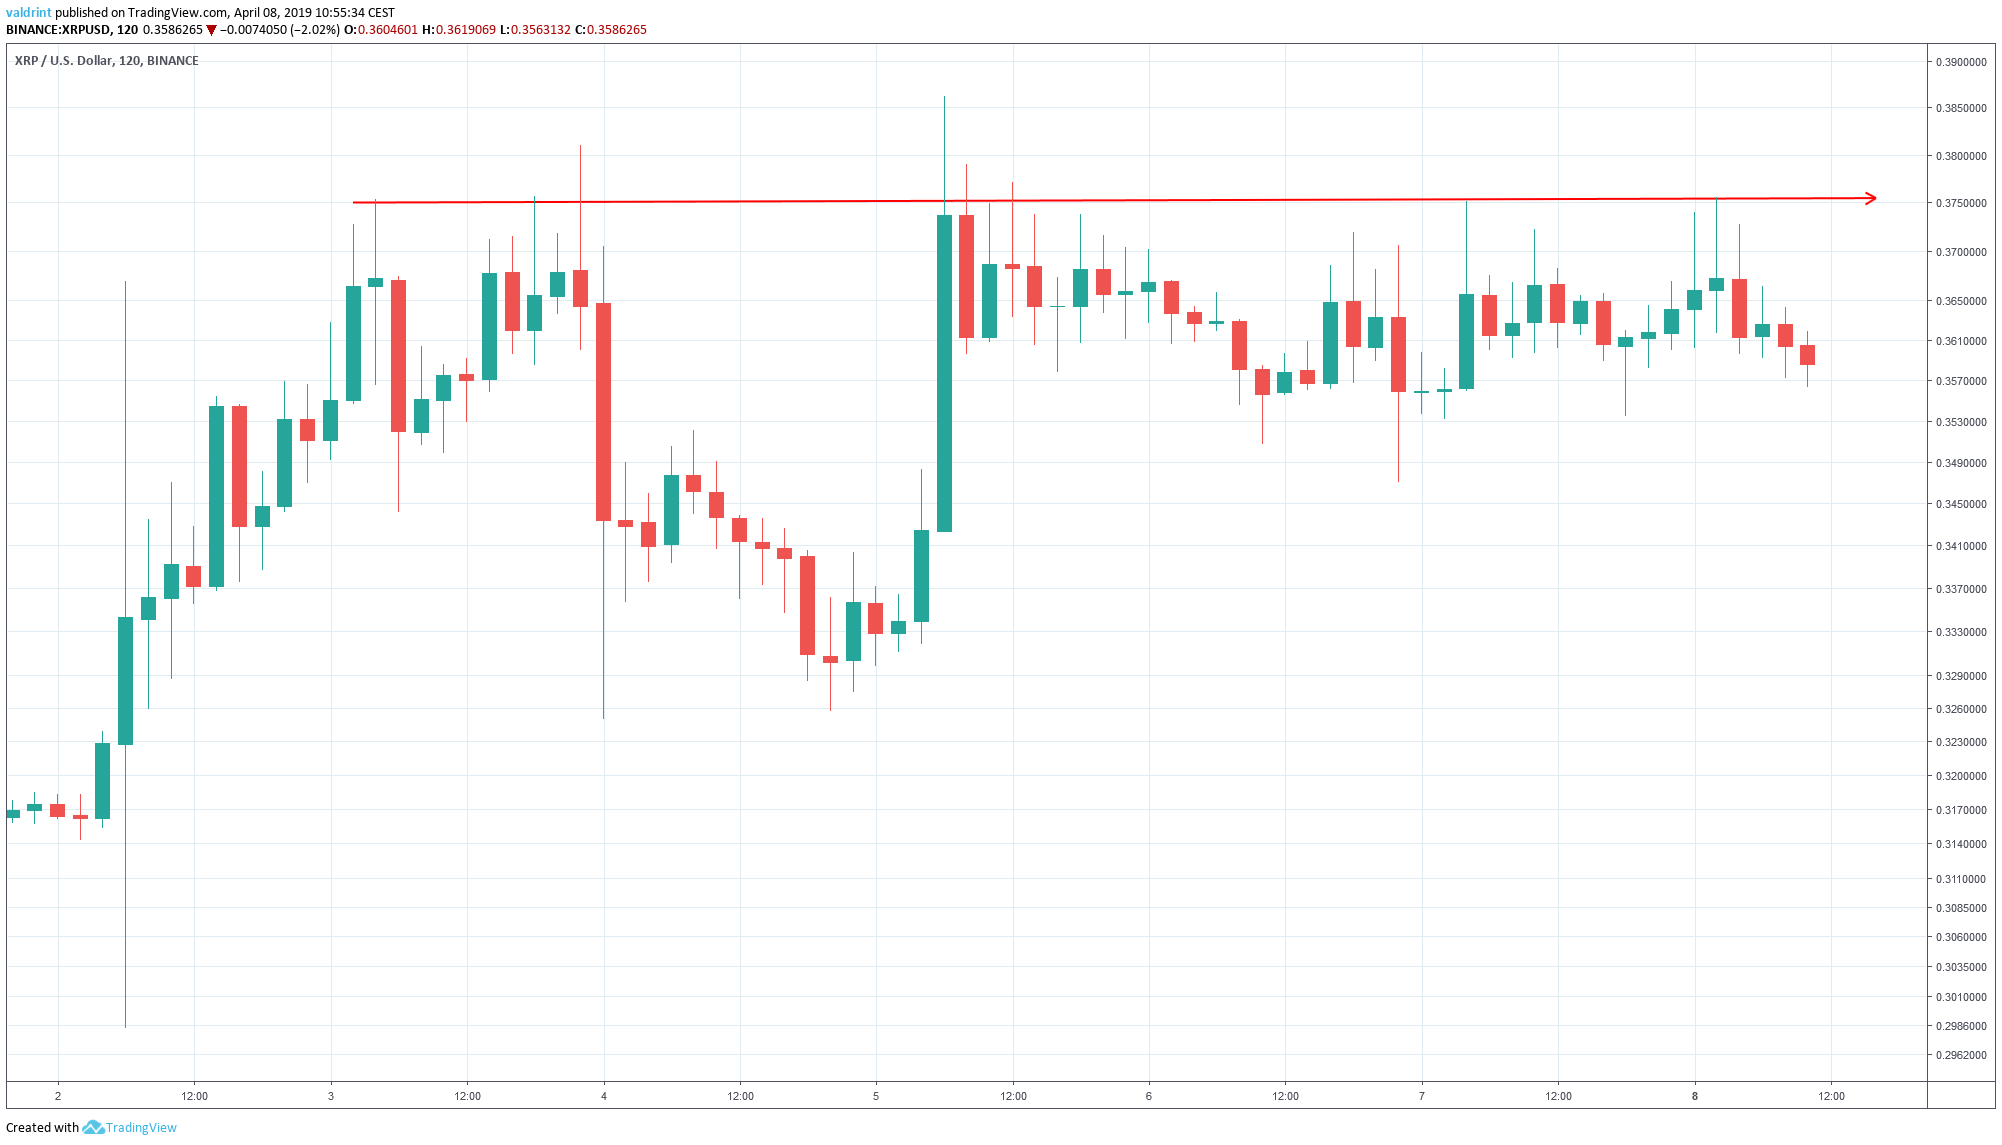
Horizontal Channel
On Apr 3, the price reached a high of $0.375. Several market cycles have been completed and the price has reached the same level several times.
Tracing these highs gives us a horizontal resistance line:
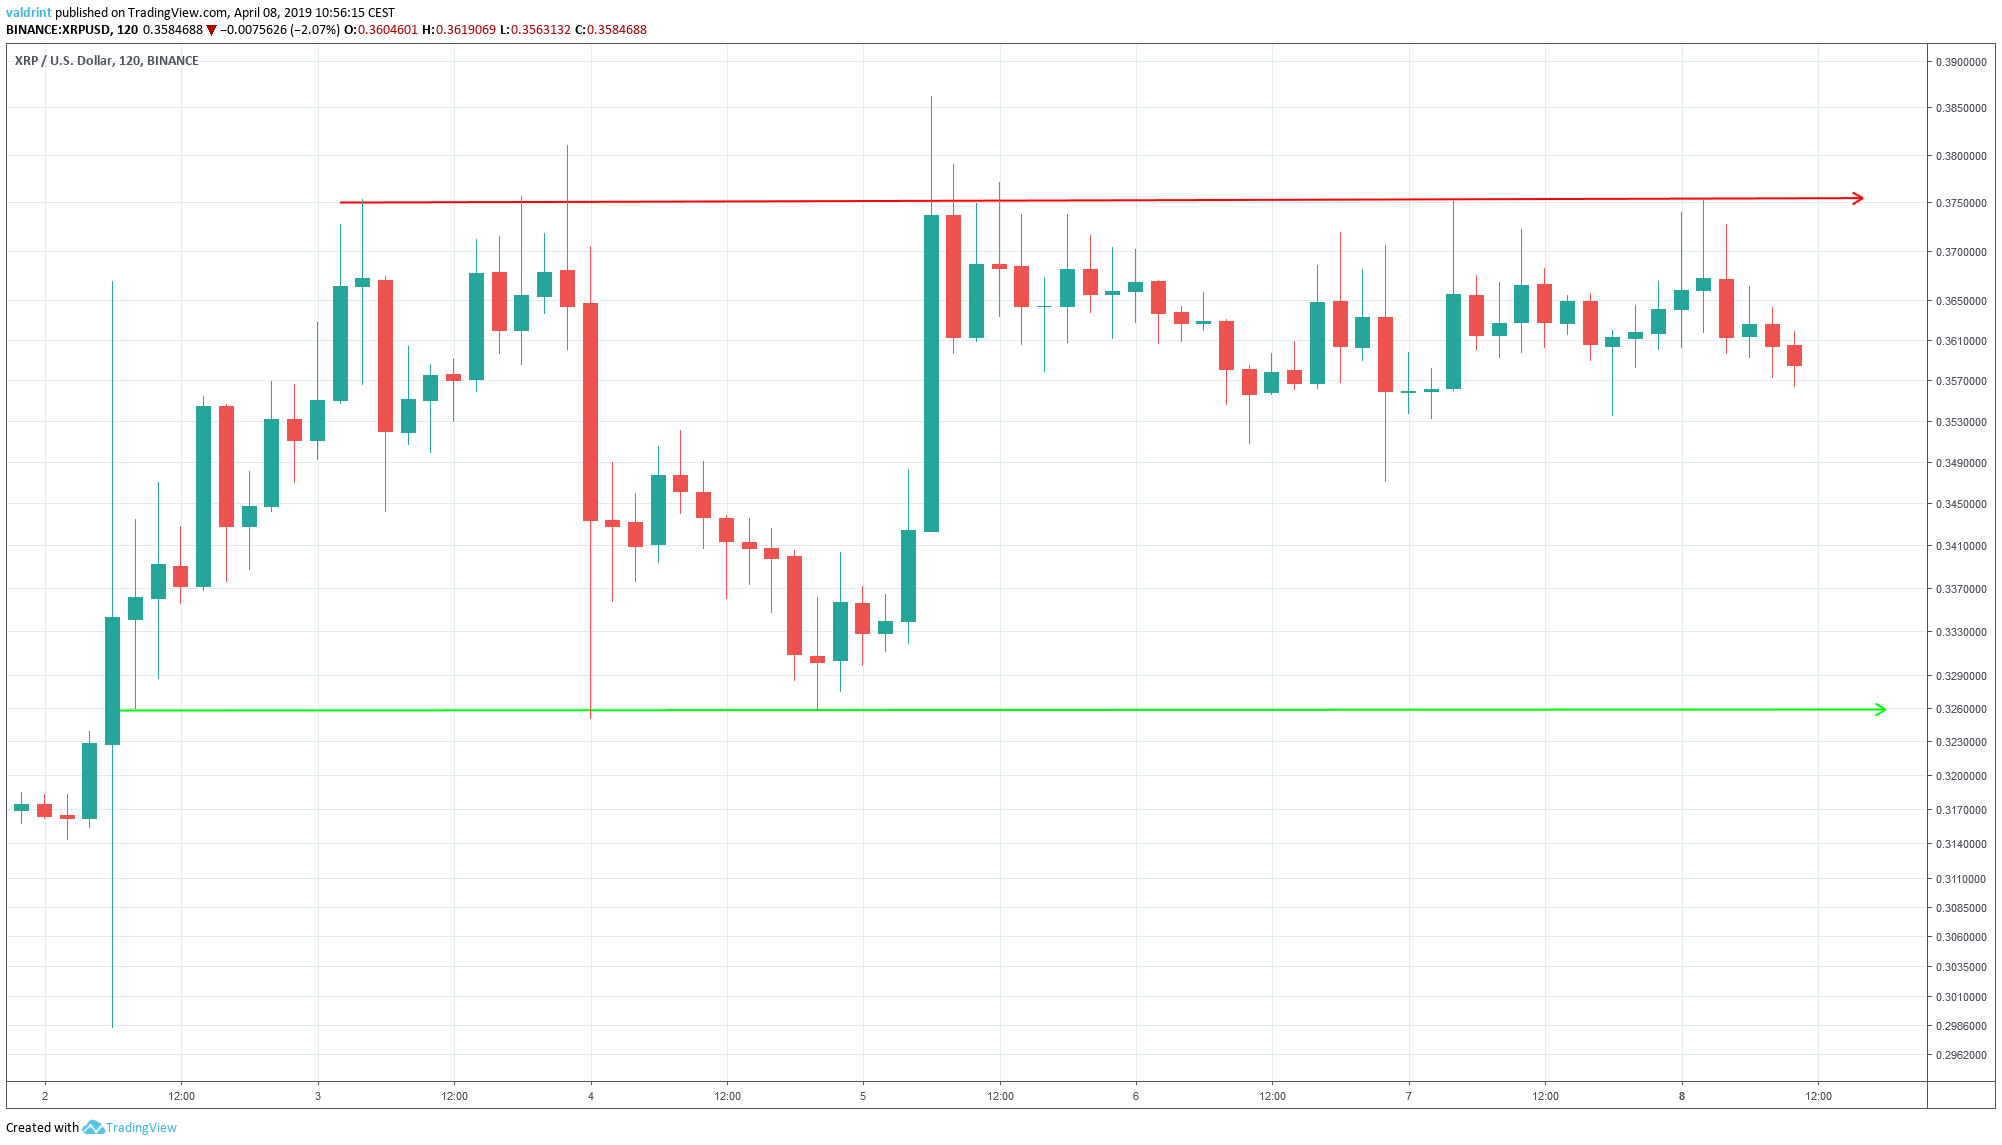
On Apr 2, the price reached an hourly low of $0.327. A gradual increase ensued, followed by a rapid decrease. The price reached the same level three times.
Tracing these lows gives us a horizontal support line.
The resistance and support lines combine to create a horizontal channel:
The price is very close to the resistance line of the channel.
Will it break out? In order to answer that, we need to take a look at some technical indicators.
SponsoredTechnical Indicators
To better assess possible future price fluctuations, we incorporate the MACD and the RSI into the analysis.
Combining MACD and RSI bullish/bearish divergence with support/resistance essentially predicts price fluctuations. Both are shown in the graph below alongside XRP’s current trading pattern:
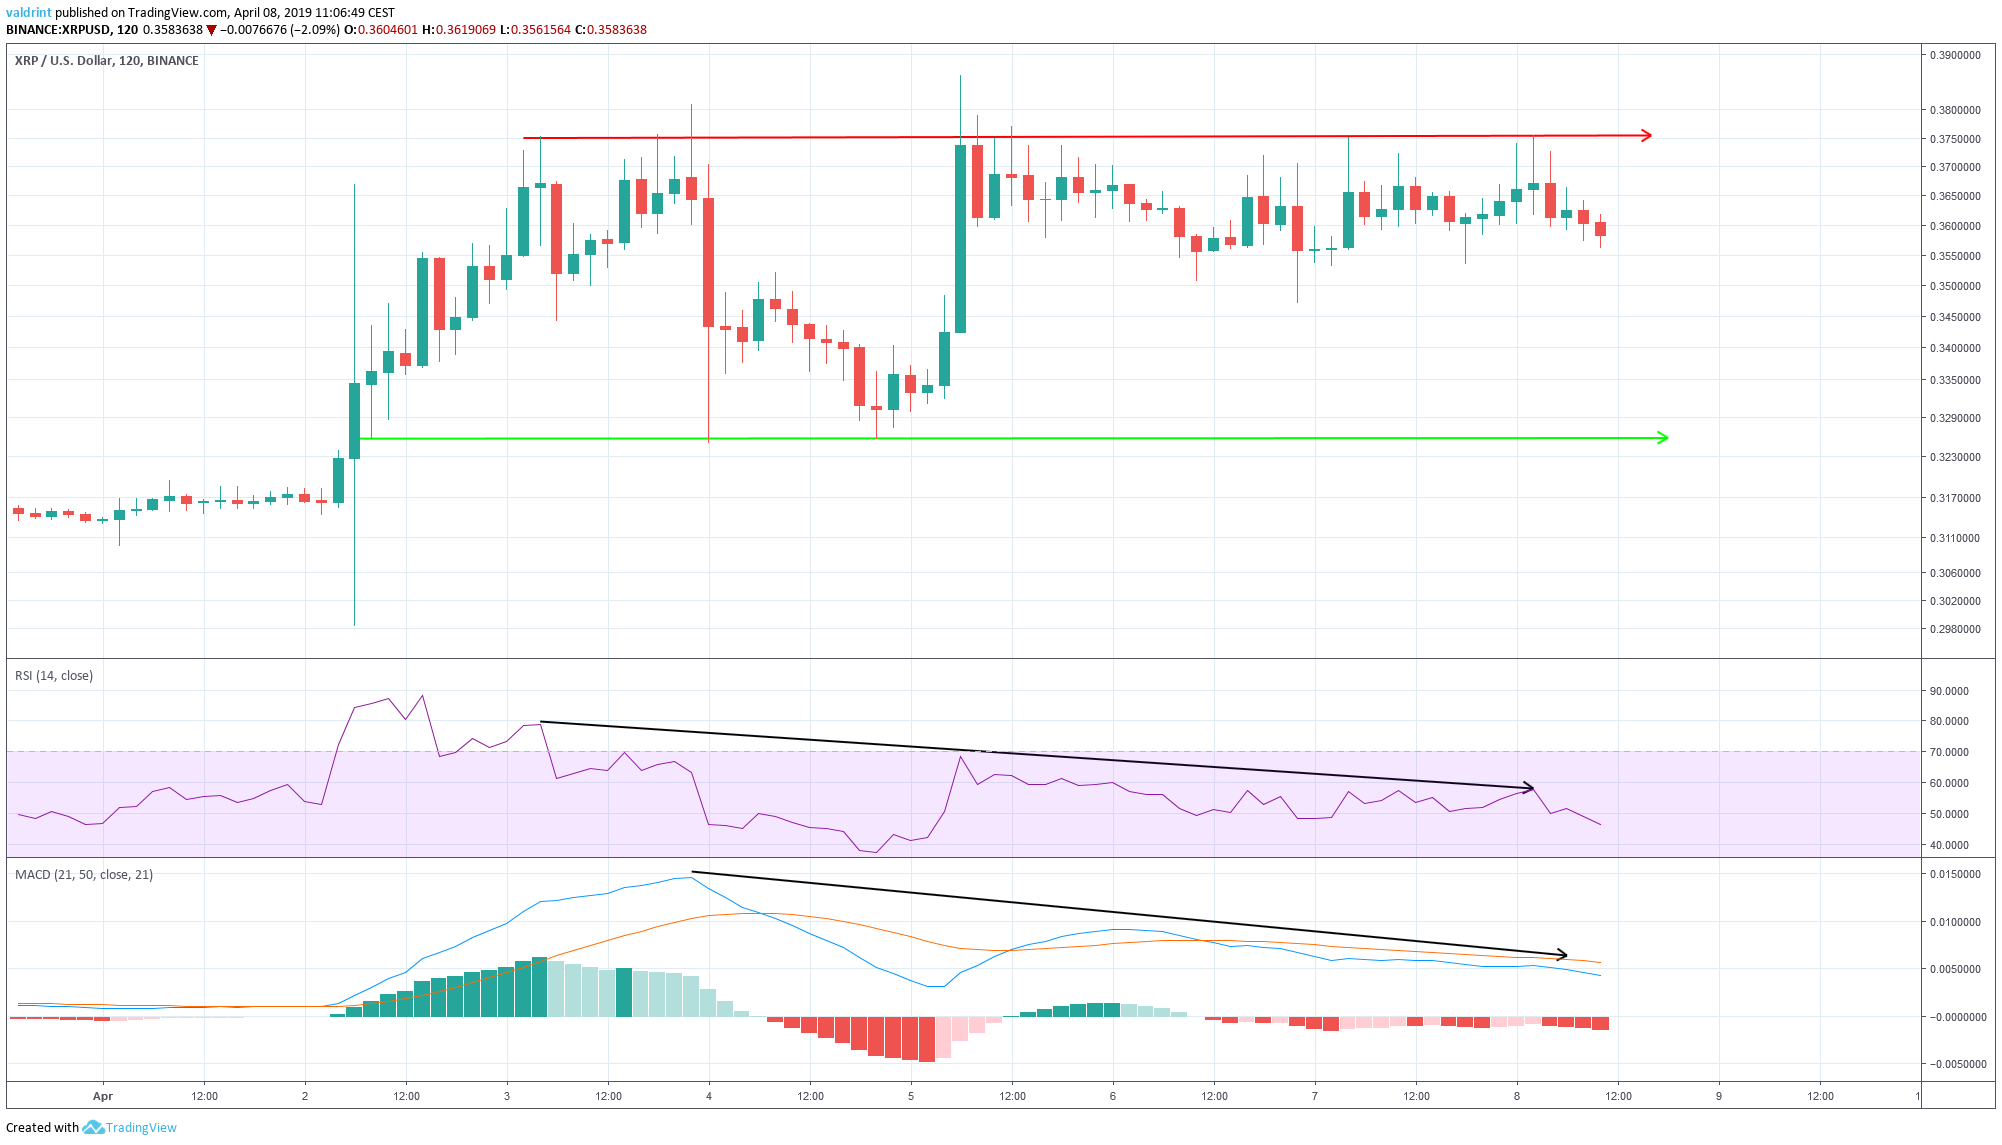
On Apr 2, the price reached a high of $0.363. It has reached or exceeded this level several times since.
Similarly, the RSI made a high on Apr 2 while the MACD made a high on Apr 3. However, both have continued to generate lower values since.
This is known as bearish divergence and often precedes price decreases.
Sponsored SponsoredUsing these indicators, it is likely that the price decreases towards the support line of the channel.
Where Might XRP’s Price Land?
To determine actual possible future price levels given a drop, we incorporate support areas into this analysis.
Sponsored Sponsored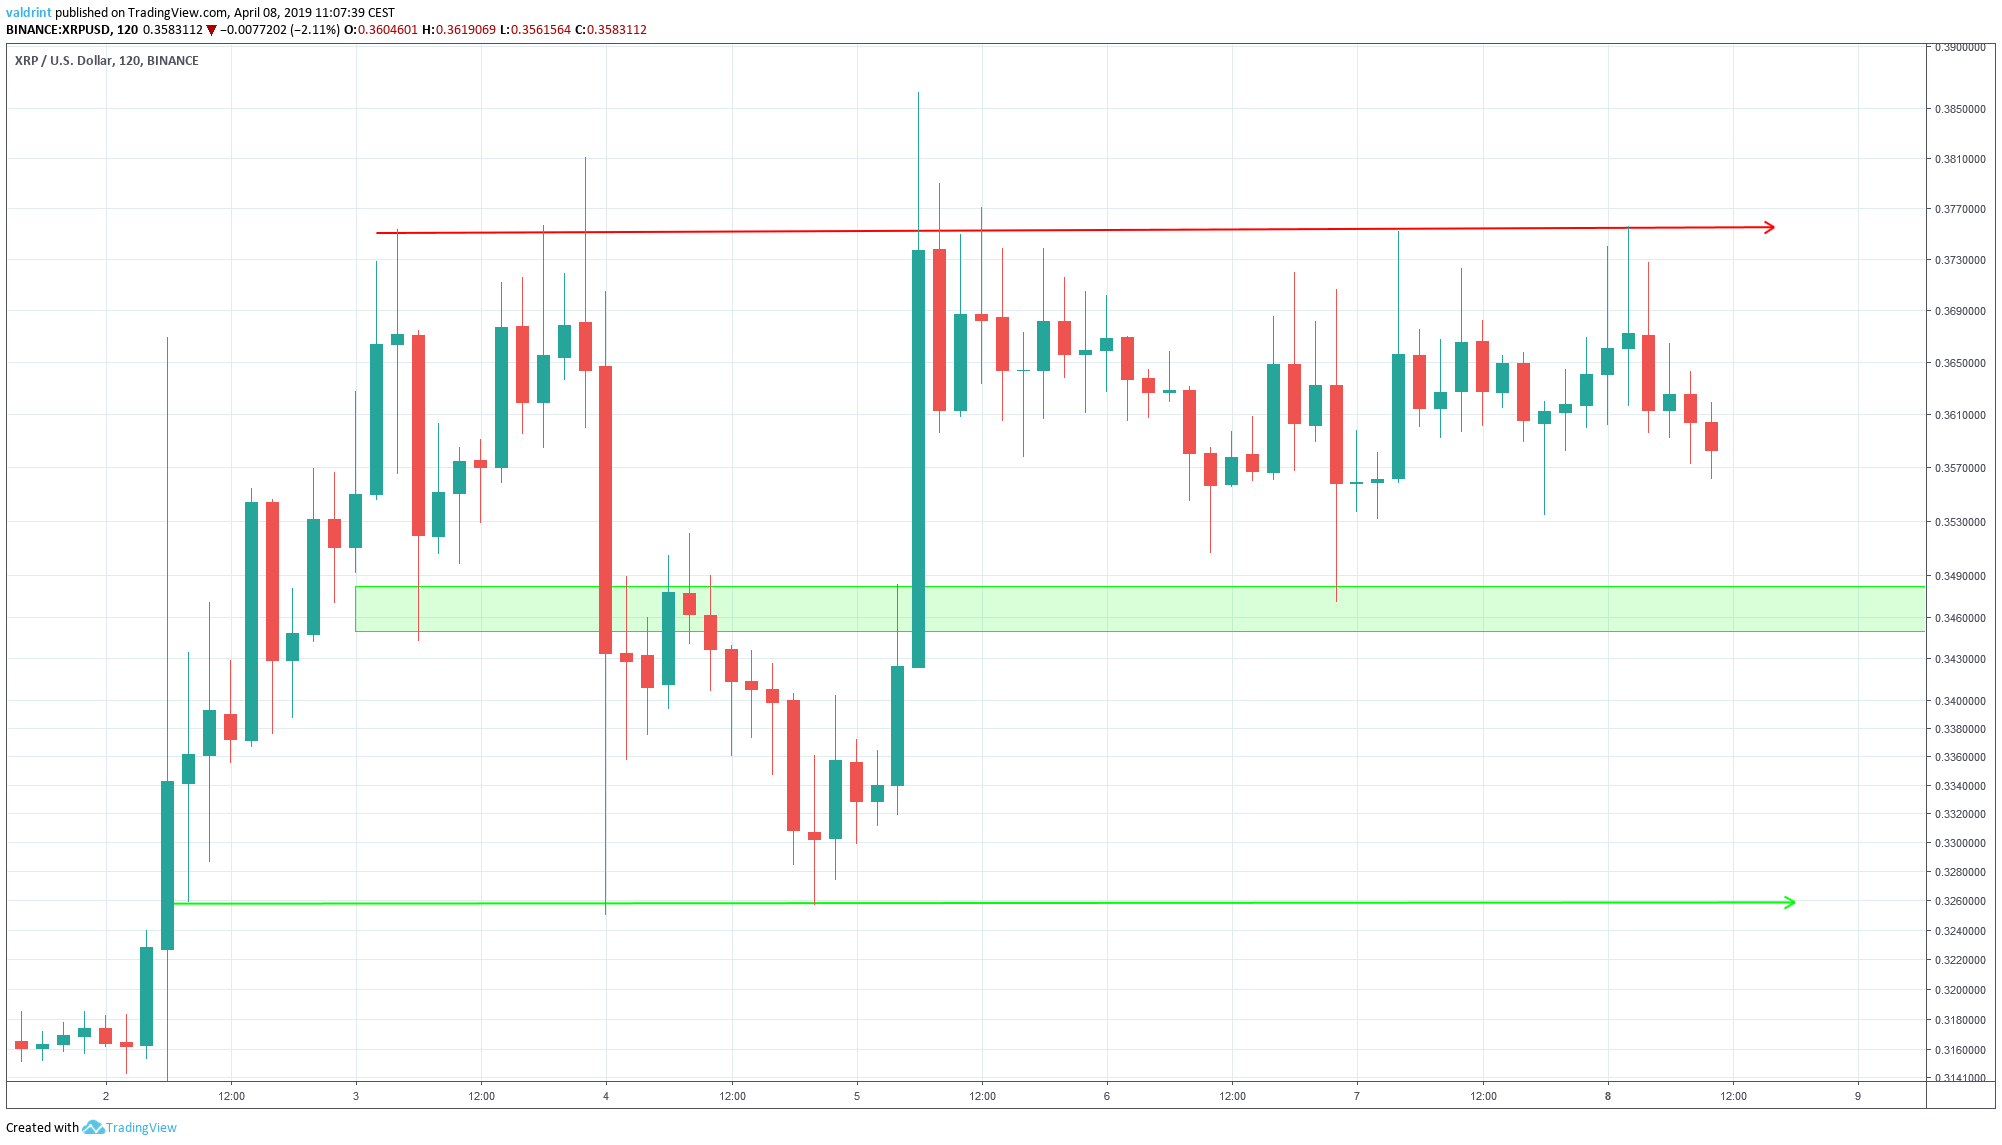
The closest support area is found near $0.345. We believe it is likely that the price will reach this area. Given that the support area is located within the middle of the channel, the price may drop below this level.
Based on this analysis, the price of XRP is likely to undergo a correction. Price is expected to drop toward the support line of the channel.
Disclaimer: This article is not trading advice and should not be construed as such. Always consult a trained financial professional before investing in cryptocurrencies, as the market is particularly volatile.
