
XRP (XRP) has been at the center of a lot of controversies recently.
A class action lawsuit has been filed against XRP for selling unregistered securities. Allegations of insider trading continue looming. Accusations that XRP is a pump and dump scheme has been reported by mainstream sources
Despite the controversy, founder and CEO of Binance Chanpeng Zhao (CZ) continues supporting XRP. On Mar 5, 2019, he argued that XRP is not a security. He also stated that people should not judge XRP as guilty of any wrongdoing until there is a final verdict from the courts.
SponsoredRyan Selkis & CZ Binance Discussing XRP
Seems more people are agreeing XRP is not a Security pic.twitter.com/IBVU17NQBH
— 𝗕𝗮𝗻𝗸XRP (@BankXRP) March 7, 2019
Key Highlights for March 6, 2019.
- The price reached a high of $0.355 on Feb 19
- It made a lower high of $0.34 on Feb 24
- A sharp drop took it down to $0.3
- Price is trading inside a symmetrical triangle.
- There is support near $0.3.
- There is resistance near $0.34.
Tracing the Resistance
The price of XRP (XRP) on Binance was analyzed in two-hour intervals between Feb 18 and Mar 6.
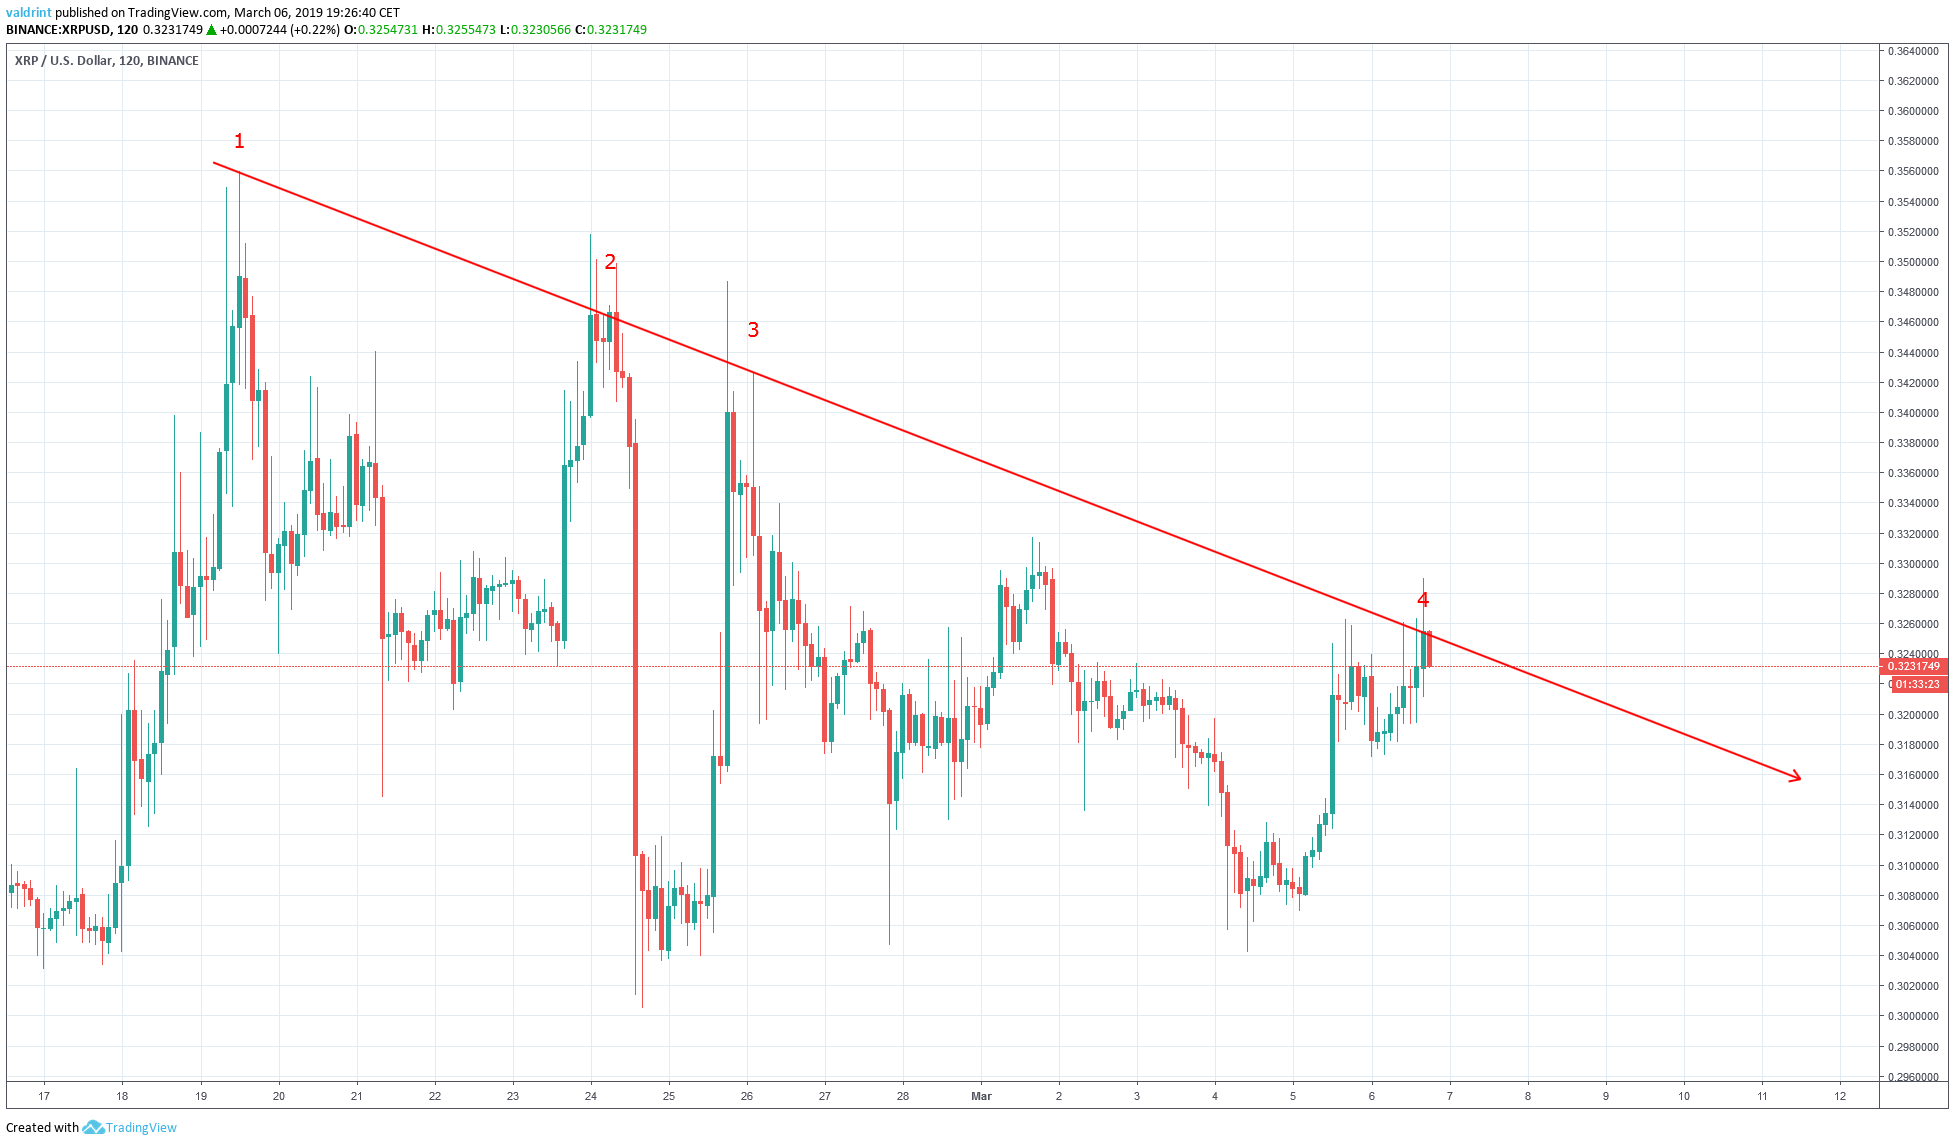
The price reached a high of $0.355 on Feb 19. A gradual drop ensued. A slight recovery saw a second lower high reached on Feb 24.
A market-wide flash crash followed. XRP lost over 10% of its value. A quick recovery saw a third lower high reached on Feb 26.
The descending resistance line is formed by tracing the successive highs.
Sponsored SponsoredThe validity of the line increases with the number of times it is touched. The line was touched four times:
- February 19
- February 24
- February 26
- March 6
Resistance and Support
After the sharp drop of Feb 24, the price reached a low of near $0.3. It continued to create higher lows.
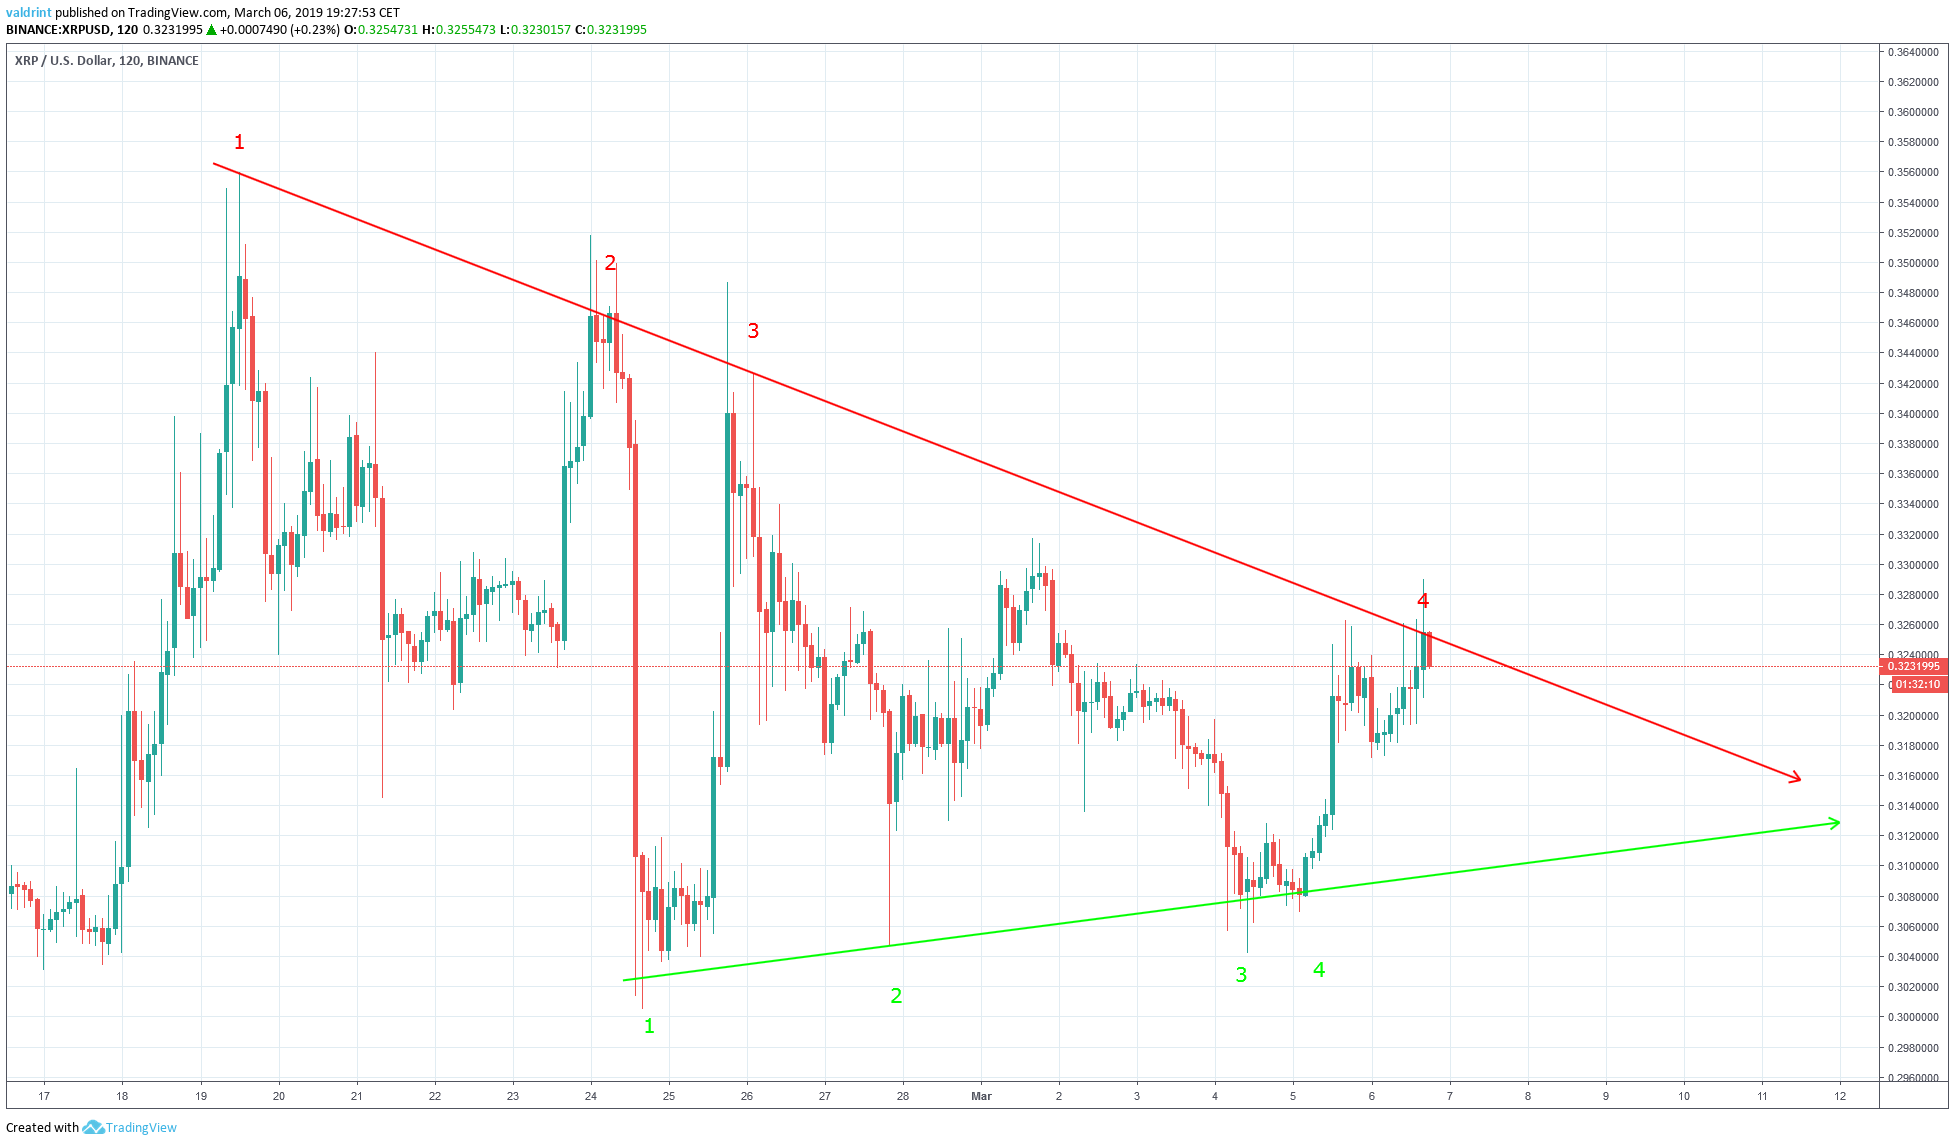
The ascending support line is created by tracing these successive lows. The line was touched four times:
- February 24
- February 26
- March 4
- March 5
The resistance and support lines combine to create a symmetrical triangle. It is a neutral pattern, meaning a breakdown and breakout are equally likely.
SponsoredThe pattern is projected to end on Mar 12. It is unclear whether there will be increases or decreases in price. Perhaps the recent support from CZ will lead price to break out of the resistance, but for now, a breakdown below support remains just as likely.
Possible Reversal
The relative strength index (RSI) is an indicator which calculates the size of the changes in price in order to determine oversold or overbought conditions in the market. It ranges from 0-100, values >70 indicating overbought conditions and <30 indicating oversold ones.
The moving average convergence divergence (MACD) is a trend indicator that shows the relationship between two moving averages (long and short-term) and the price. It is used to measure the strength of a move.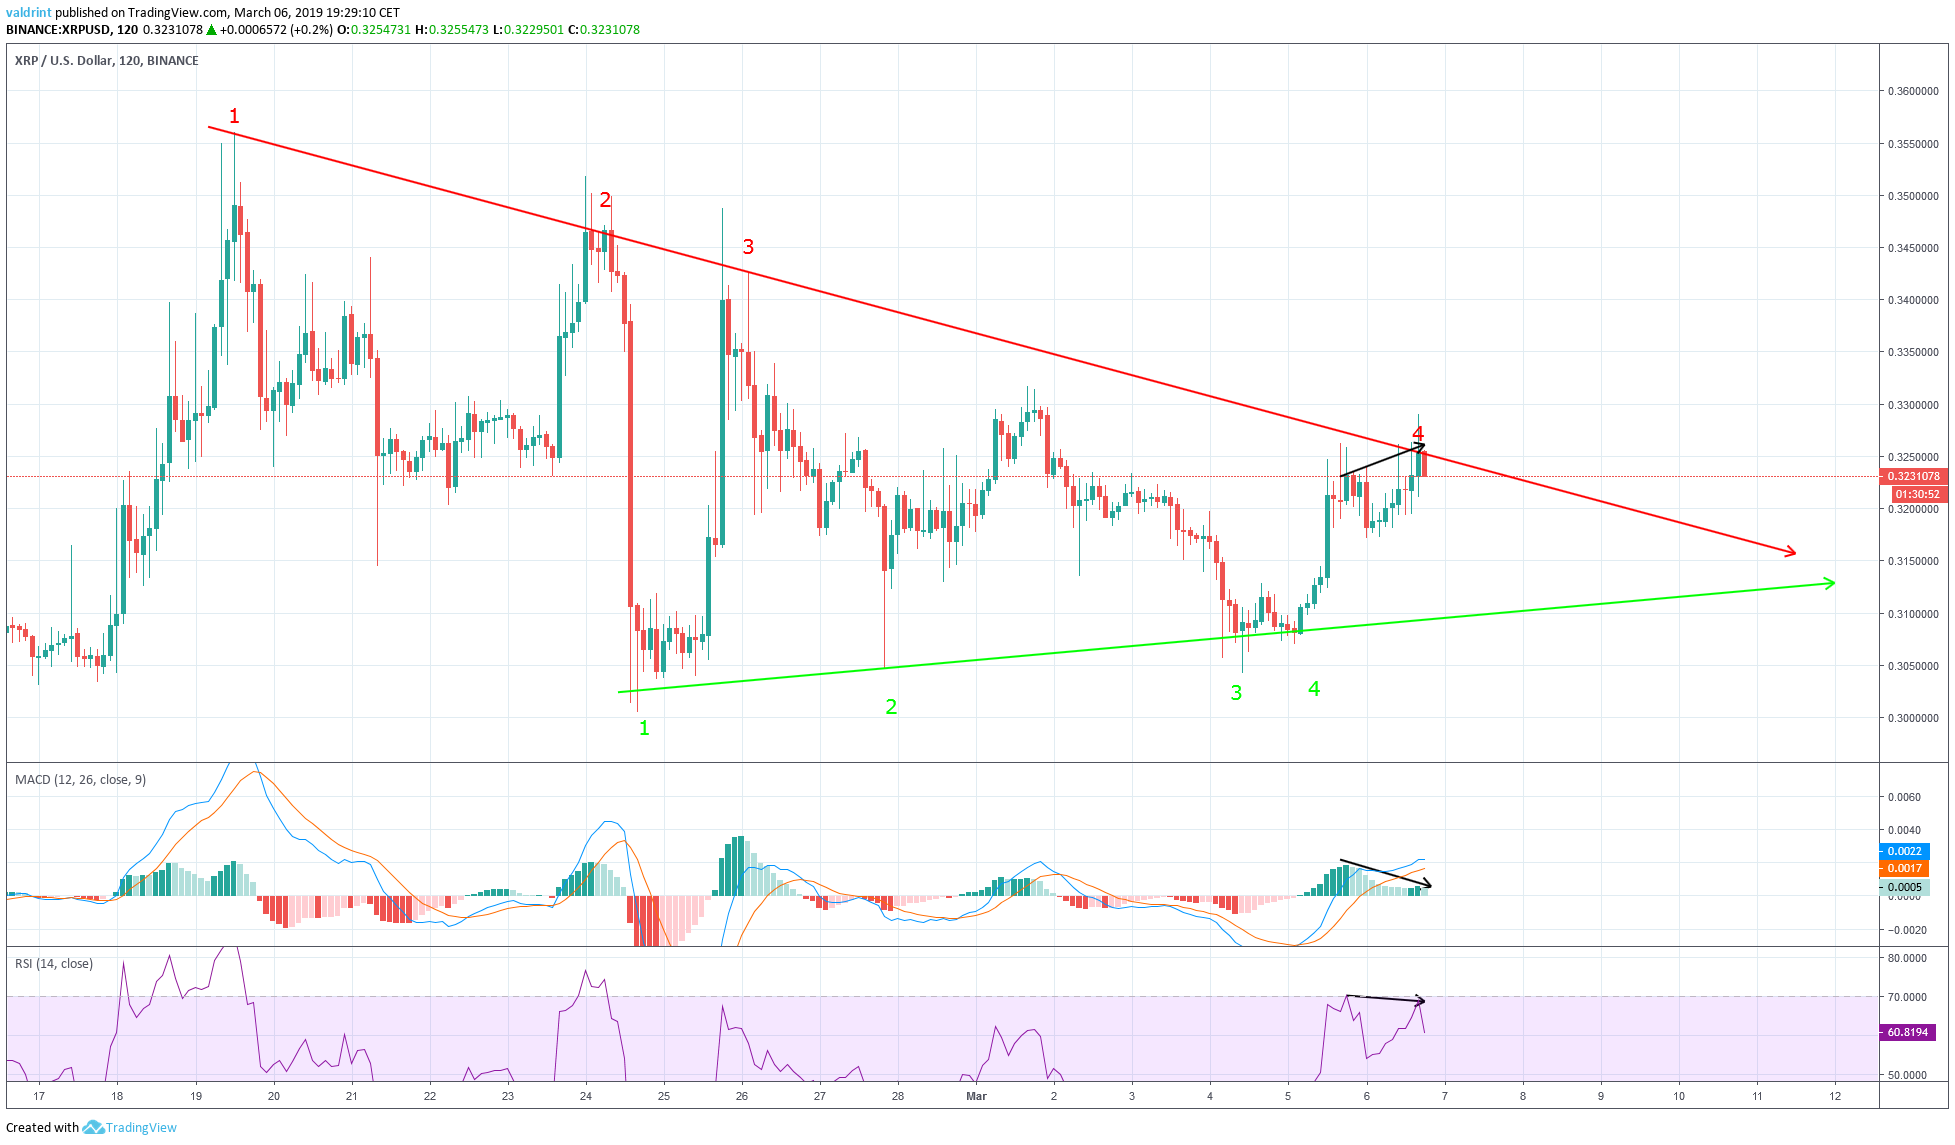
The price reached a level of $0.323 on Mar 5. It reached a level of $0.329 on March 6.
During the same interval, the MACD and RSI reached a swing high on Mar 5. However, they both made lower highs on Mar 6.
This is called bearish divergence. It often precedes drops in price. The use of divergence in the RSI and the MACD combined with the use of support/resistance lines can be effective in predicting a reversal.
Sponsored SponsoredIt is especially effective in predicting reversals if a bearish divergence occurs in a bearish pattern and vice versa. This is not the case in XRP.
Future Movements
Resistance and support areas are found when the price reaches a certain level several times. Resistance acts as a floor while support acts as the ceiling, effectively preventing the price from moving further into that direction. Together they create a structure which aims to limit price movements. 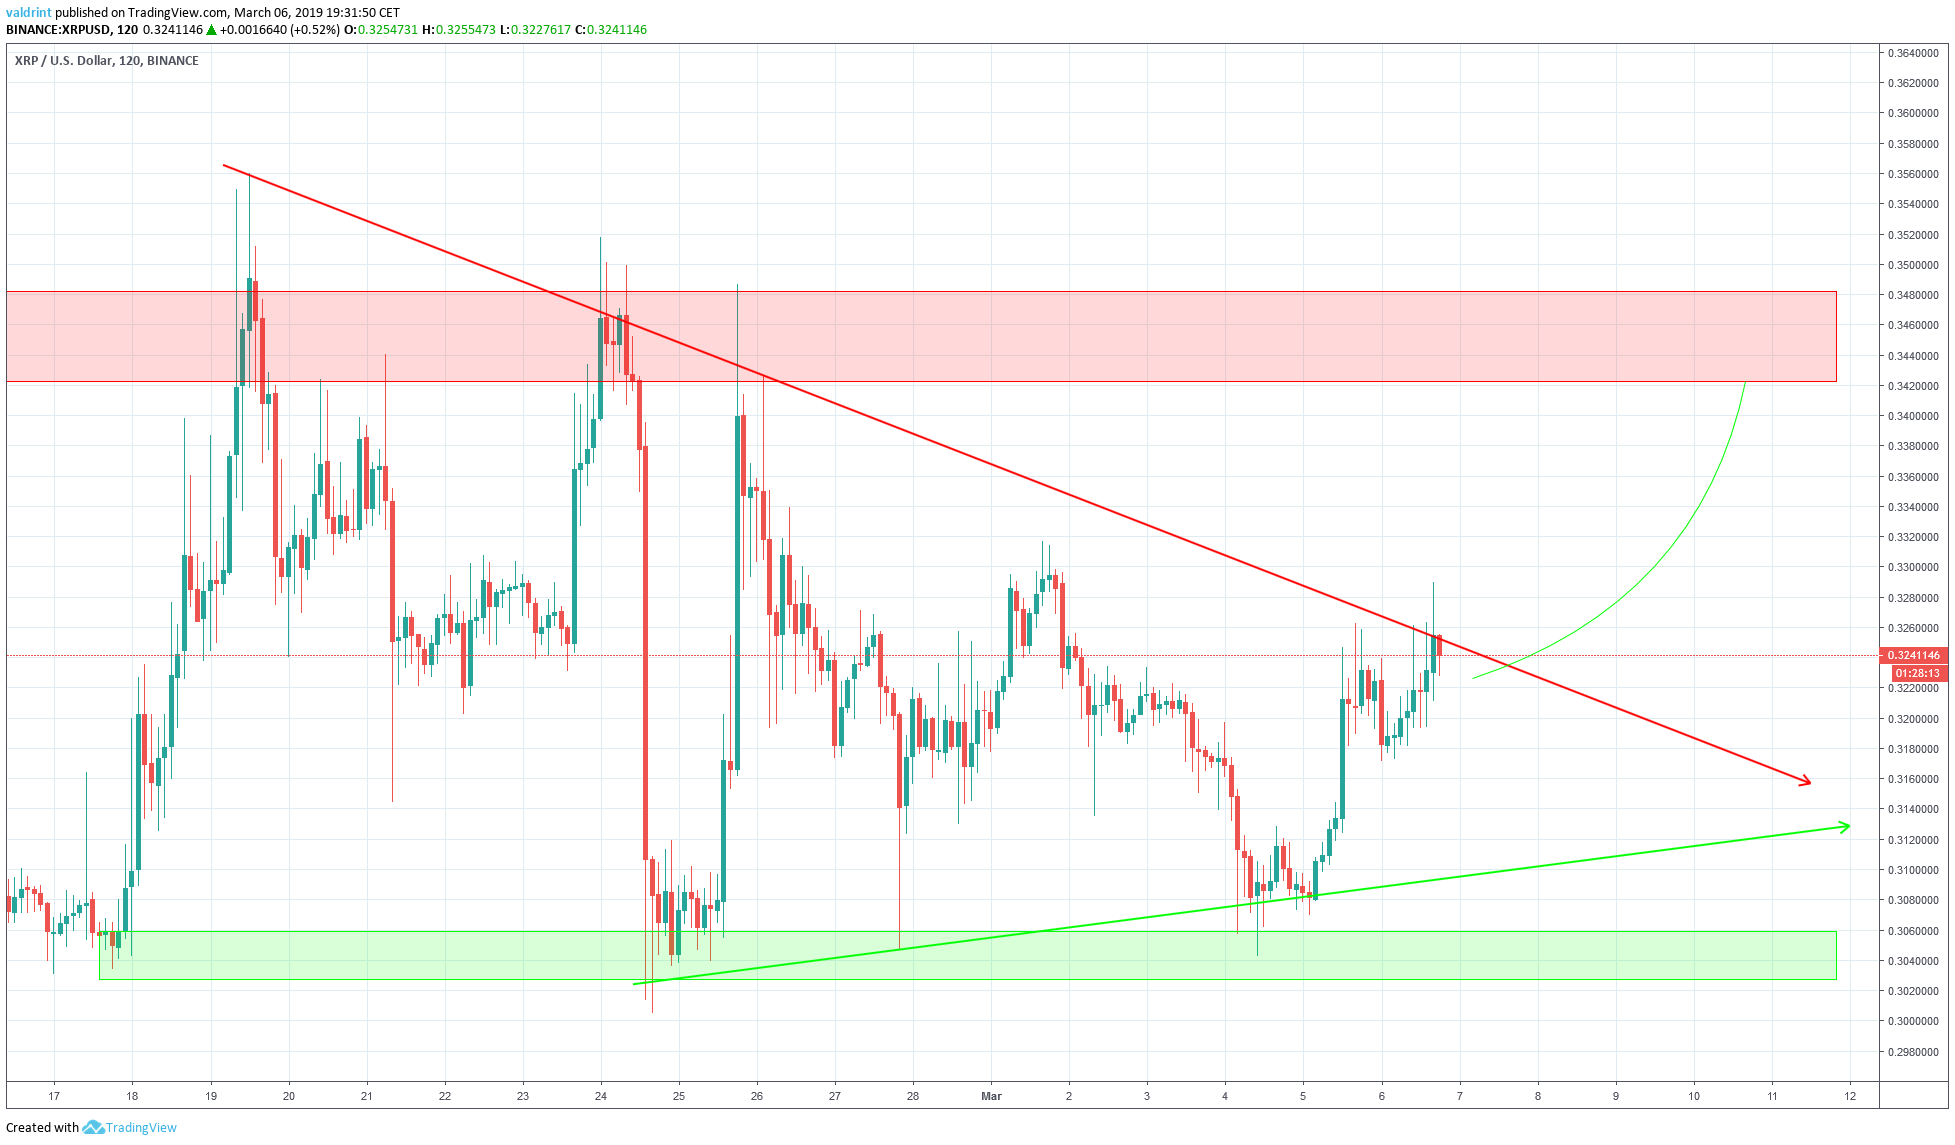
In the image above, the areas outlined may be helpful in predicting likely price stops. Such stops often occur when a breakout from a pattern takes place.
Sponsored SponsoredThere is a resistance area near $0.34.
There is a support area near $0.30.
Given the above information, XRP may fall back to the support line of the triangle.
Do you think XRP will break out of the triangle on this attempt? Let us know in the comments below, and check our more in-depth XRP analysis and price prediction here.
Disclaimer: This article is not trading advice and should not be construed as such. Always consult a trained financial professional before investing in cryptocurrencies, as the market is particularly volatile.
