Matic Network (MATIC) is trading above a long-term rising support line but has yet to move above a crucial resistance area.
Loom Network (LOOM) is trading inside a bullish pattern but has yet to break out.
Long-Term Outlook
SponsoredThe MATIC price has been following a long-term rising support line since its inception in May 2019. At the time of writing, it was trading slightly above this support line.
Technical indicators are bullish. The weekly RSI is back above 50, and the price is trading above the 50-week moving average (MA), which due to the lack of sufficient data, is the longest weekly MA chart that can be plotted.
However, the price is still facing considerable resistance at 300 satoshis. Despite having twice touched prices above here, it proceeded to create long upper wicks and then close below.
Therefore, until the price successfully clears this area, we cannot with certainty state that the trend is bullish.
Sponsored Sponsored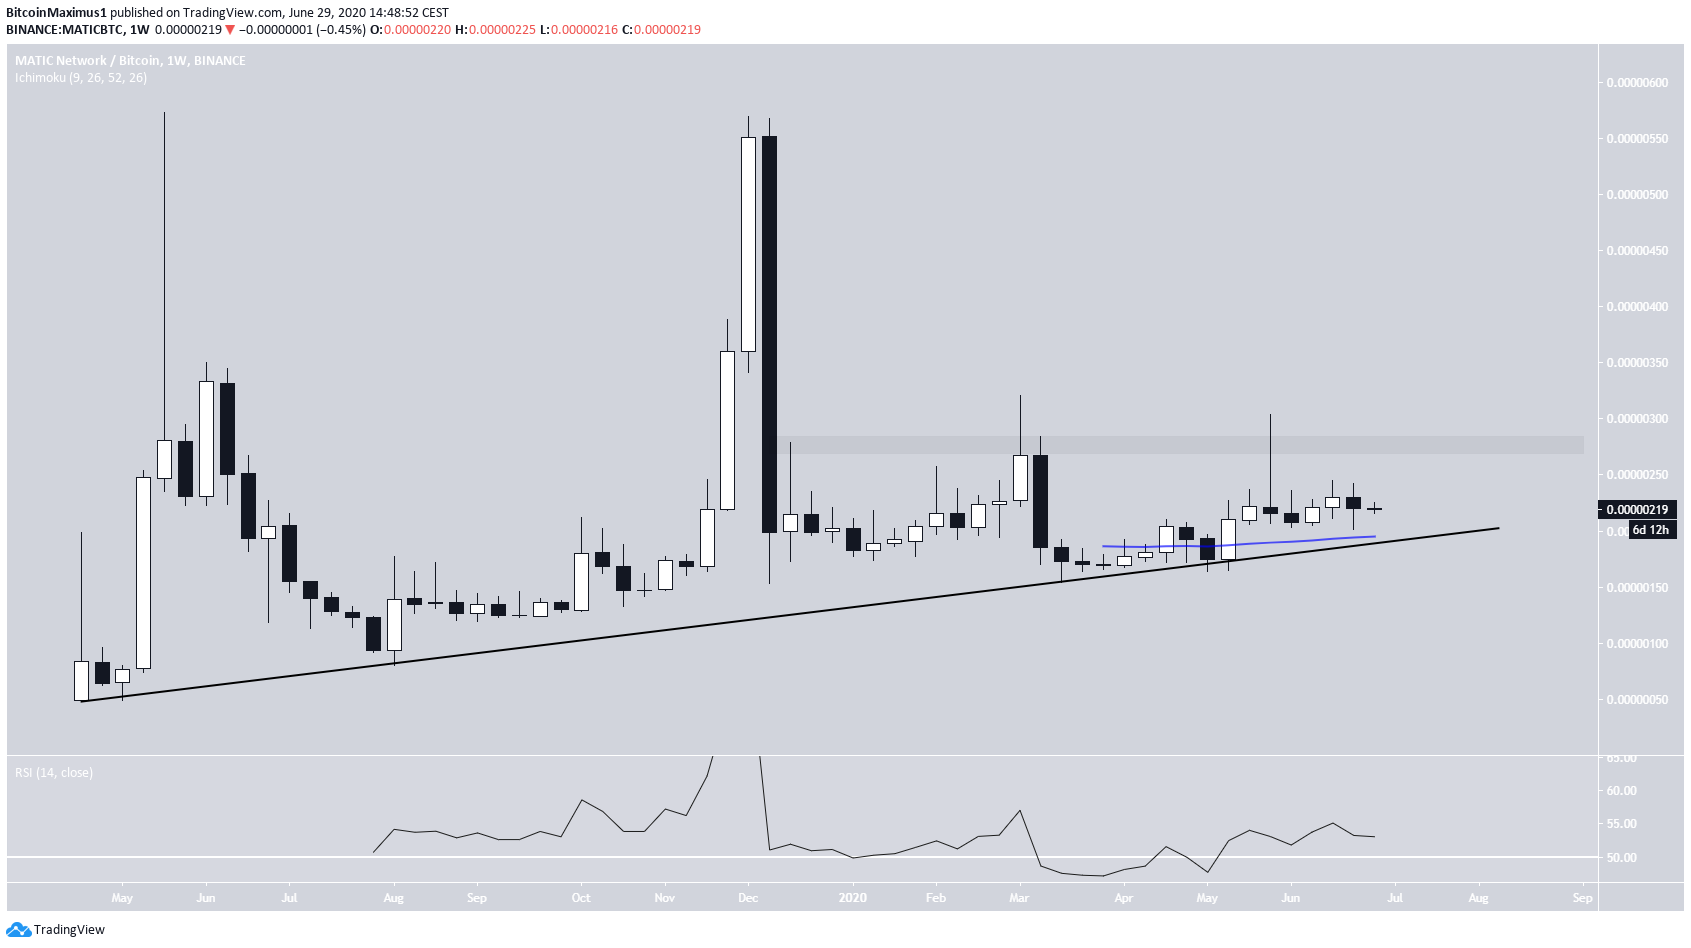
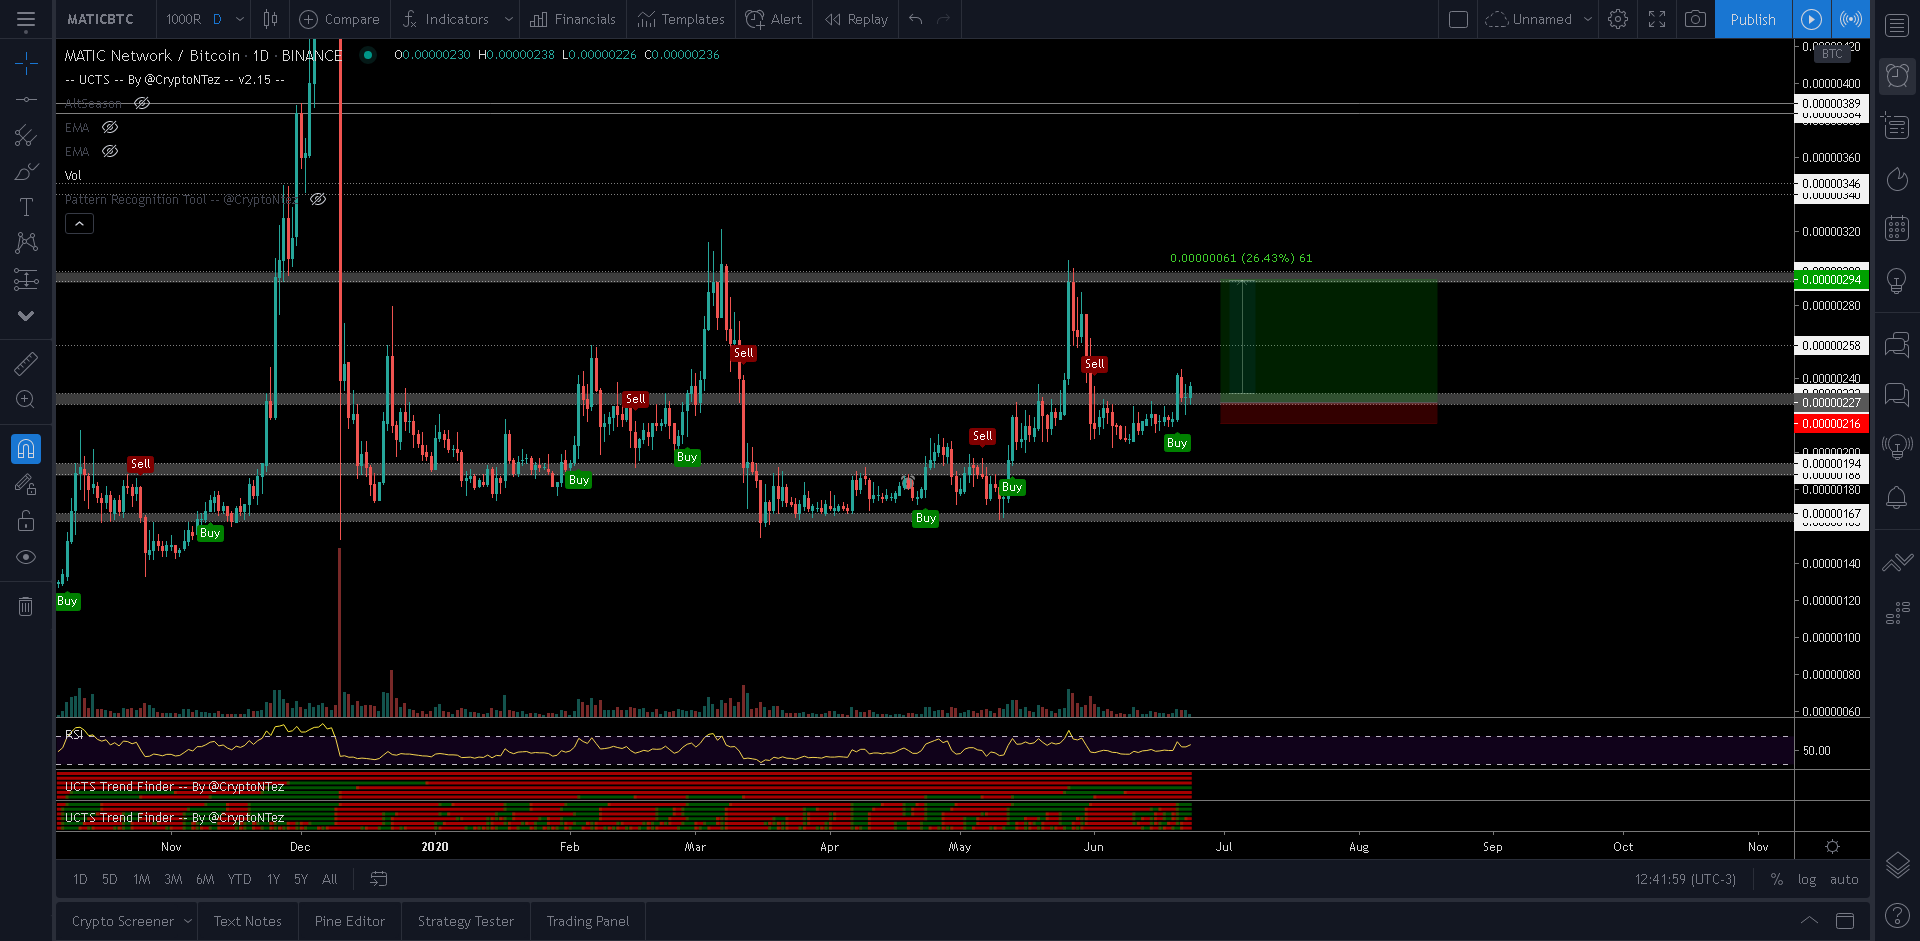
A similar sentiment is shared by cryptocurrency trader @CryptoNTez, who explains that the MATIC price could increase all the way up to 260-300 satoshis, if successful in holding the current price level.
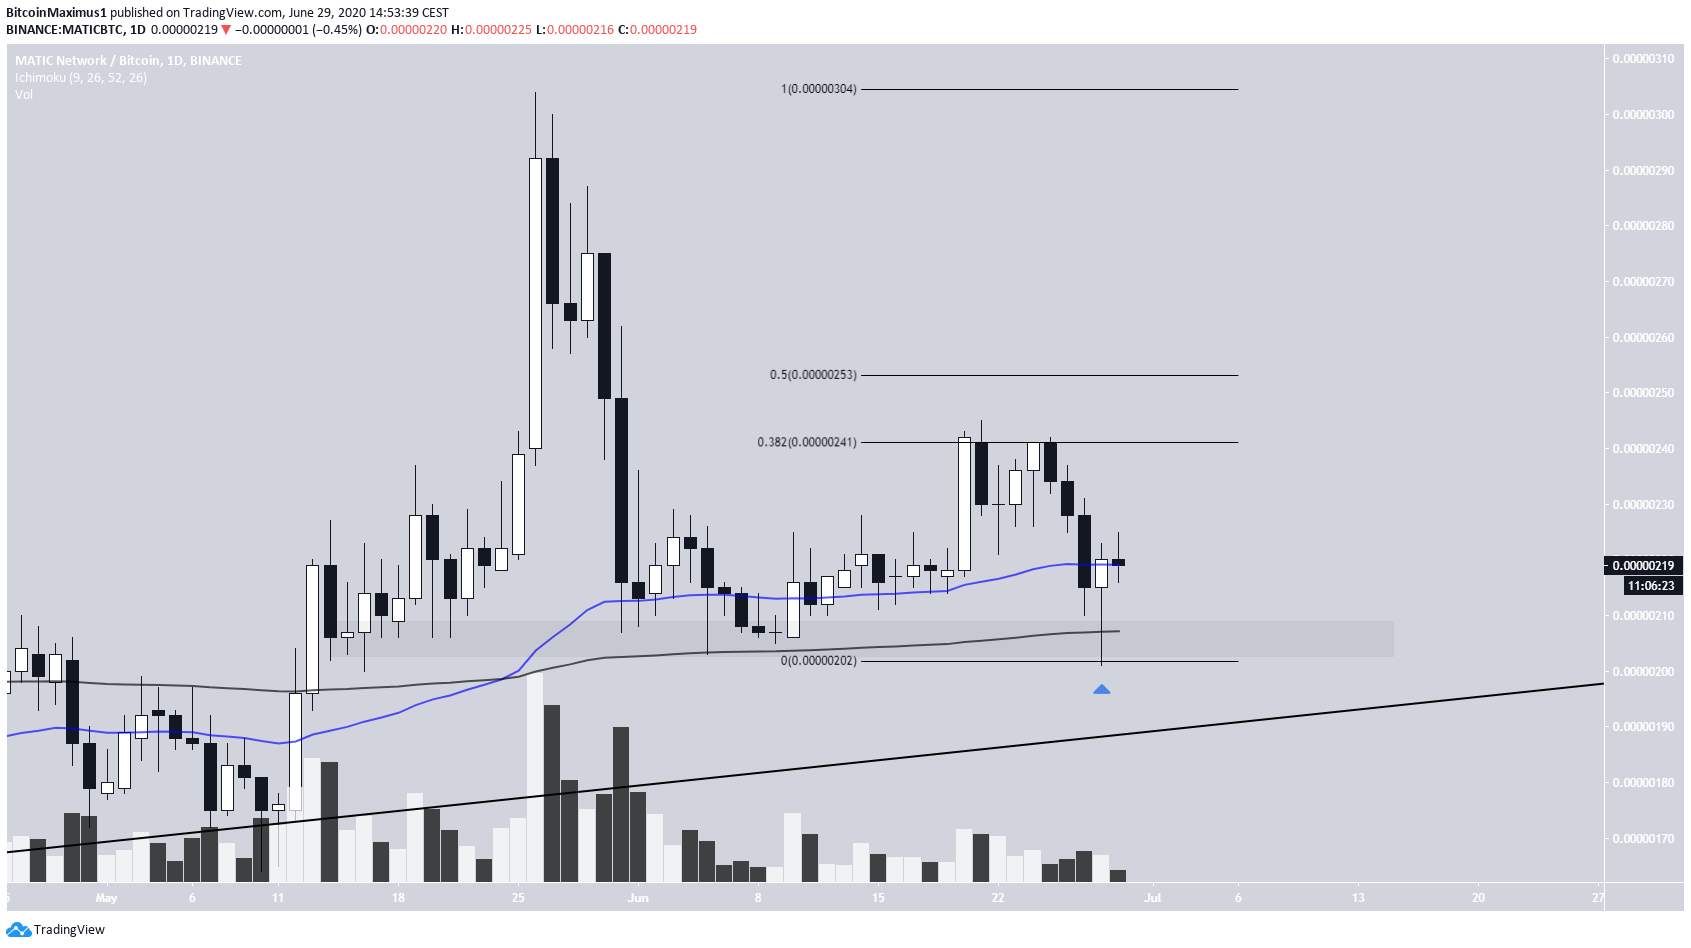
In the short-term, the price is trading above the 210 satoshi support area, which has held since May 15. This area coincides with the 200-day MA. On June 28, the price created a bullish hammer candlestick inside this area, a sign of reversal.
Furthermore, the 50 and 200-day MAs have made a bullish cross, and the price is trying to flip the former as support. If it’s successful in doing so, we could soon see an upward move towards 250, and then 300 satoshis.
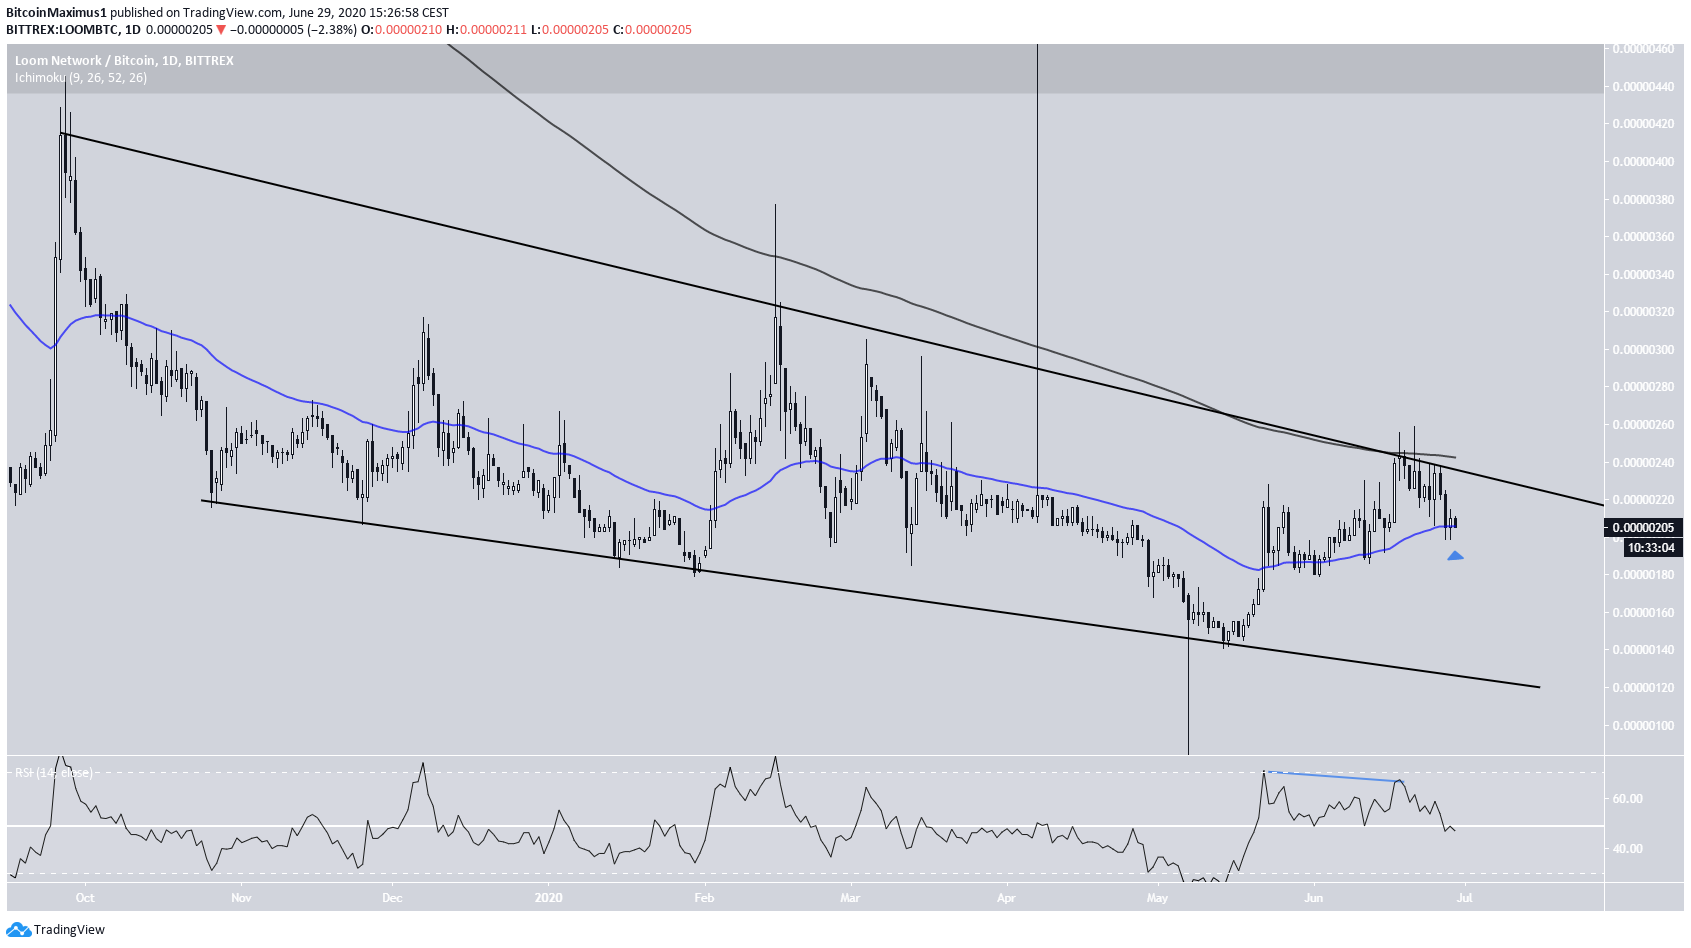
Loom Network (LOOM)
SponsoredThe LOOM price has been trading inside a long-term descending wedge since October 2019. At the time of writing, it was trading slightly below the resistance line of the pattern, after it was rejected by the 200-day moving average (MA) on June 21. This decline was also preceded by considerable bearish divergence on the daily RSI.
Currently, the price is trading slightly above the 50-day MA, which has been a remarkably good predictor of the trend so far. The RSI is at 50, so we cannot determine yet whether the trend is bullish or bearish.
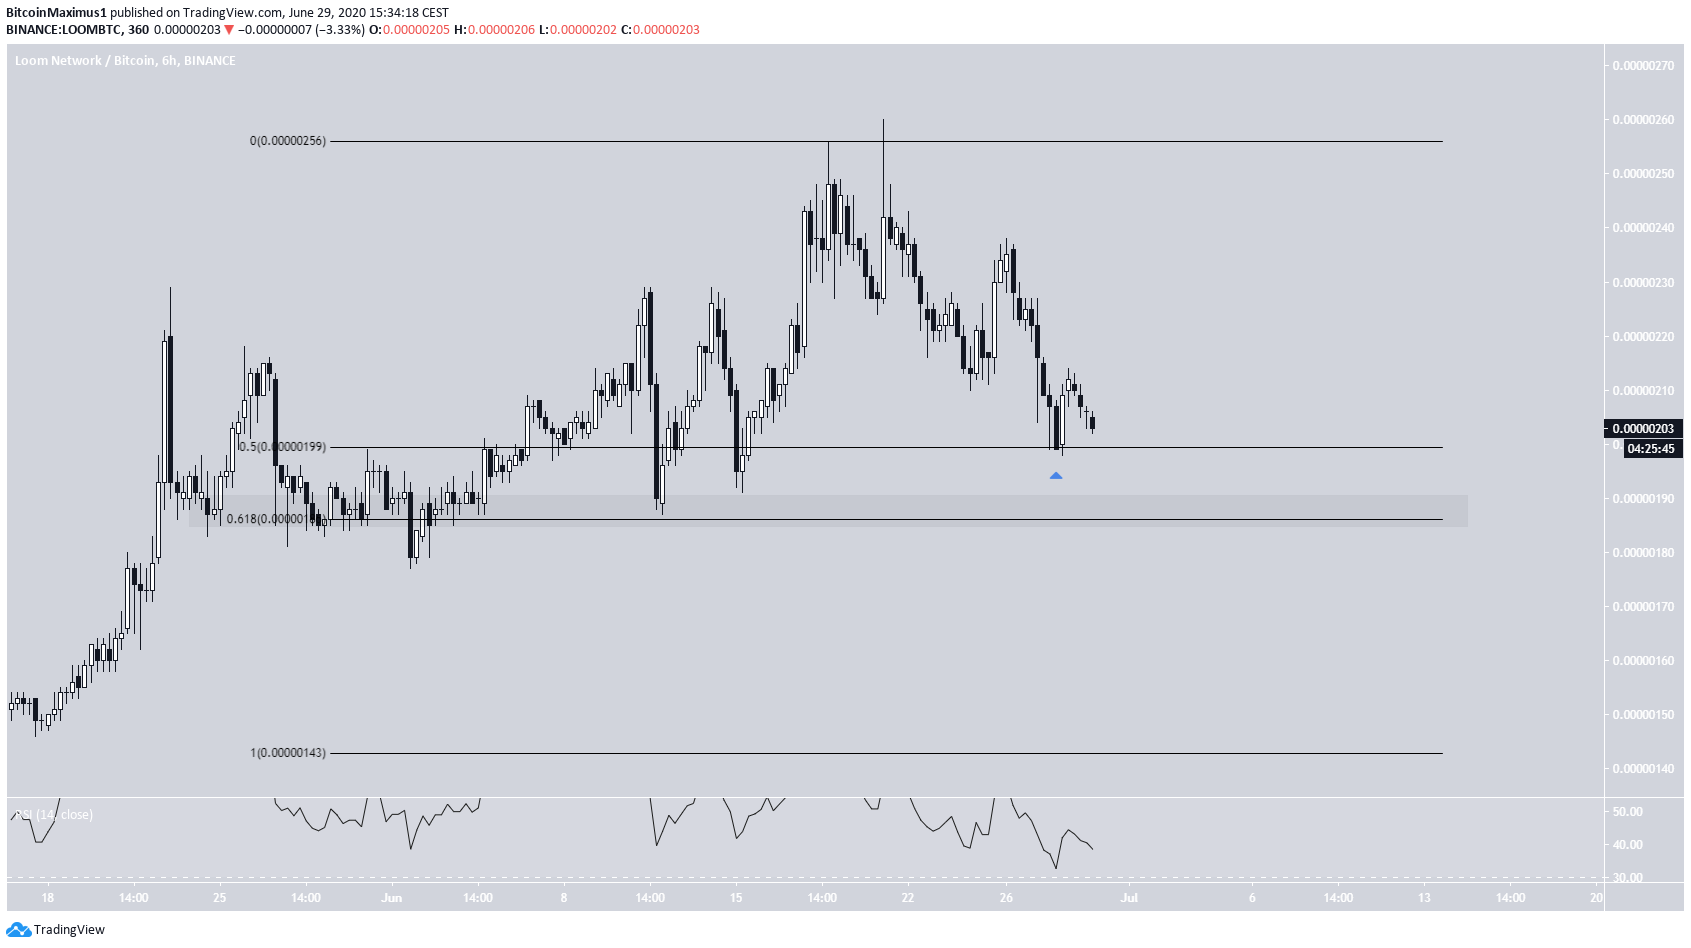
The shorter-term chart shows that the price has bounced at the 0.5 Fib level of the entire upward move. However, the bounce was short-lived, and the price has returned to the same level again. Furthermore, there is no bullish divergence on the RSI to warn of a reversal.
Therefore, it seems more likely that LOOM will fall to the 0.618 Fib level at 286 satoshis before reversing.