
Tron (TRX) has been decreasing since the end of May, but further accelerated its rate of descent last week. It is possible that the decrease is occurring as a result of the de-pegging of USDD, which had been announced as an overcollateralized stablecoin.
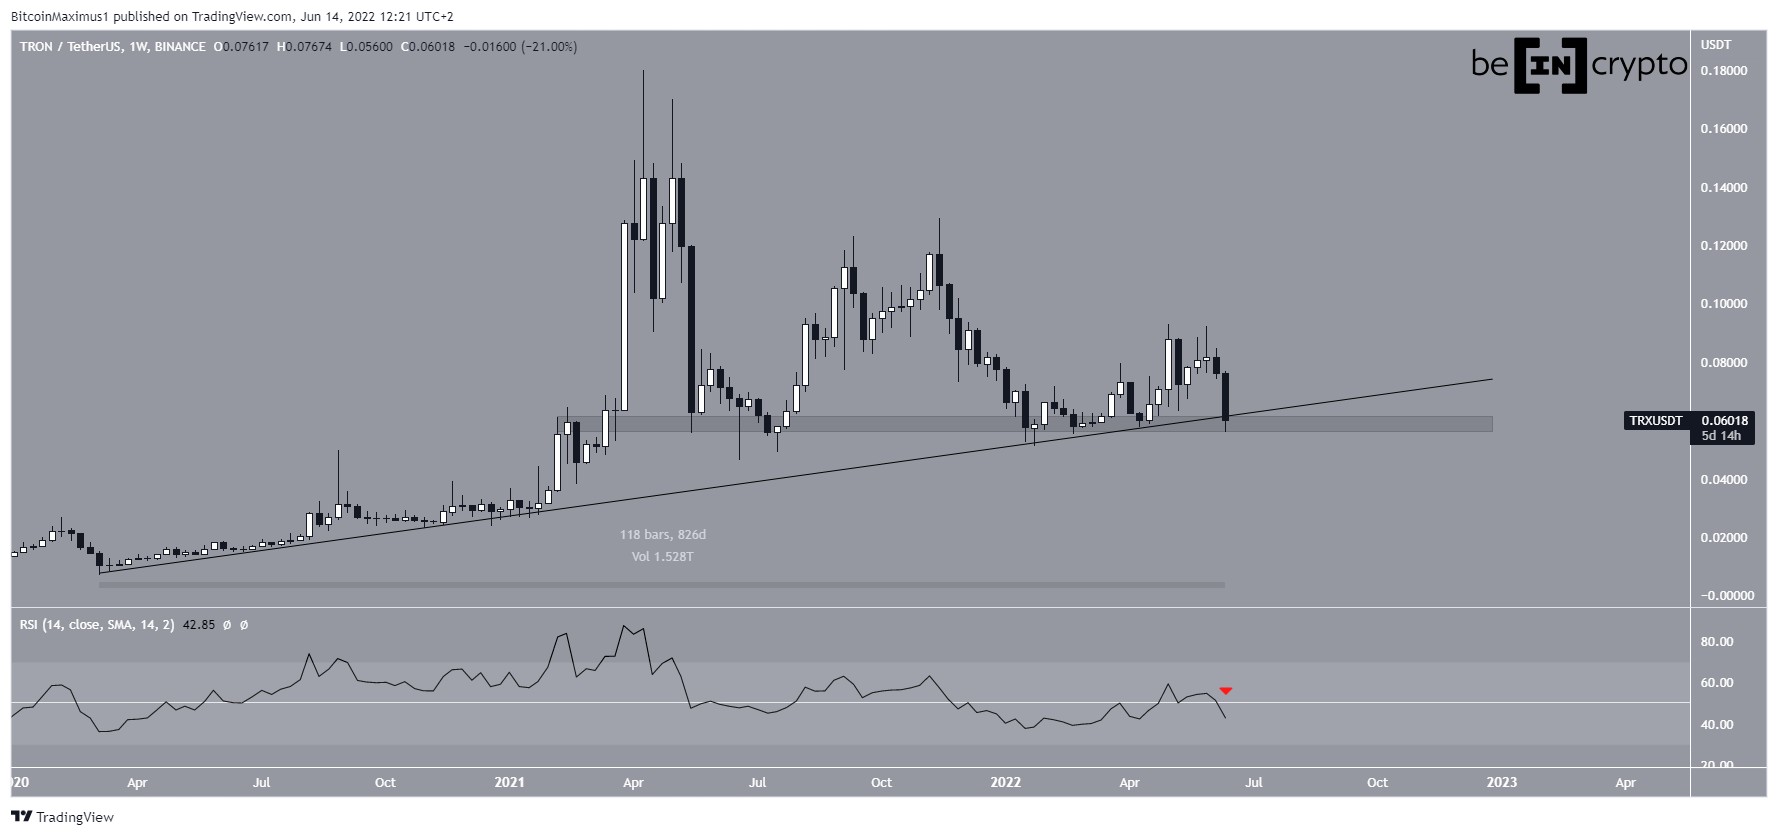
TRX has been falling since reaching an all-time high price of $0.18 in April 2021. Throughout this downward movement, it has bounced four times at the $0.058 horizontal support area, which had been in place since March 2021.
SponsoredAdditionally, the price has bounced at an ascending support line that has been in place since March 2020.
However, the downward movement that began in May 2022 is threatening to cause a breakdown from both these levels. If this occurs, it would be an extremely bearish sign that would likely lead to an acceleration of the downward movement.
Additionally, after what previously seemed like a reclaim, the weekly RSI has now fallen back below 50 (red icon). This is also considered a sign of bearish trends.
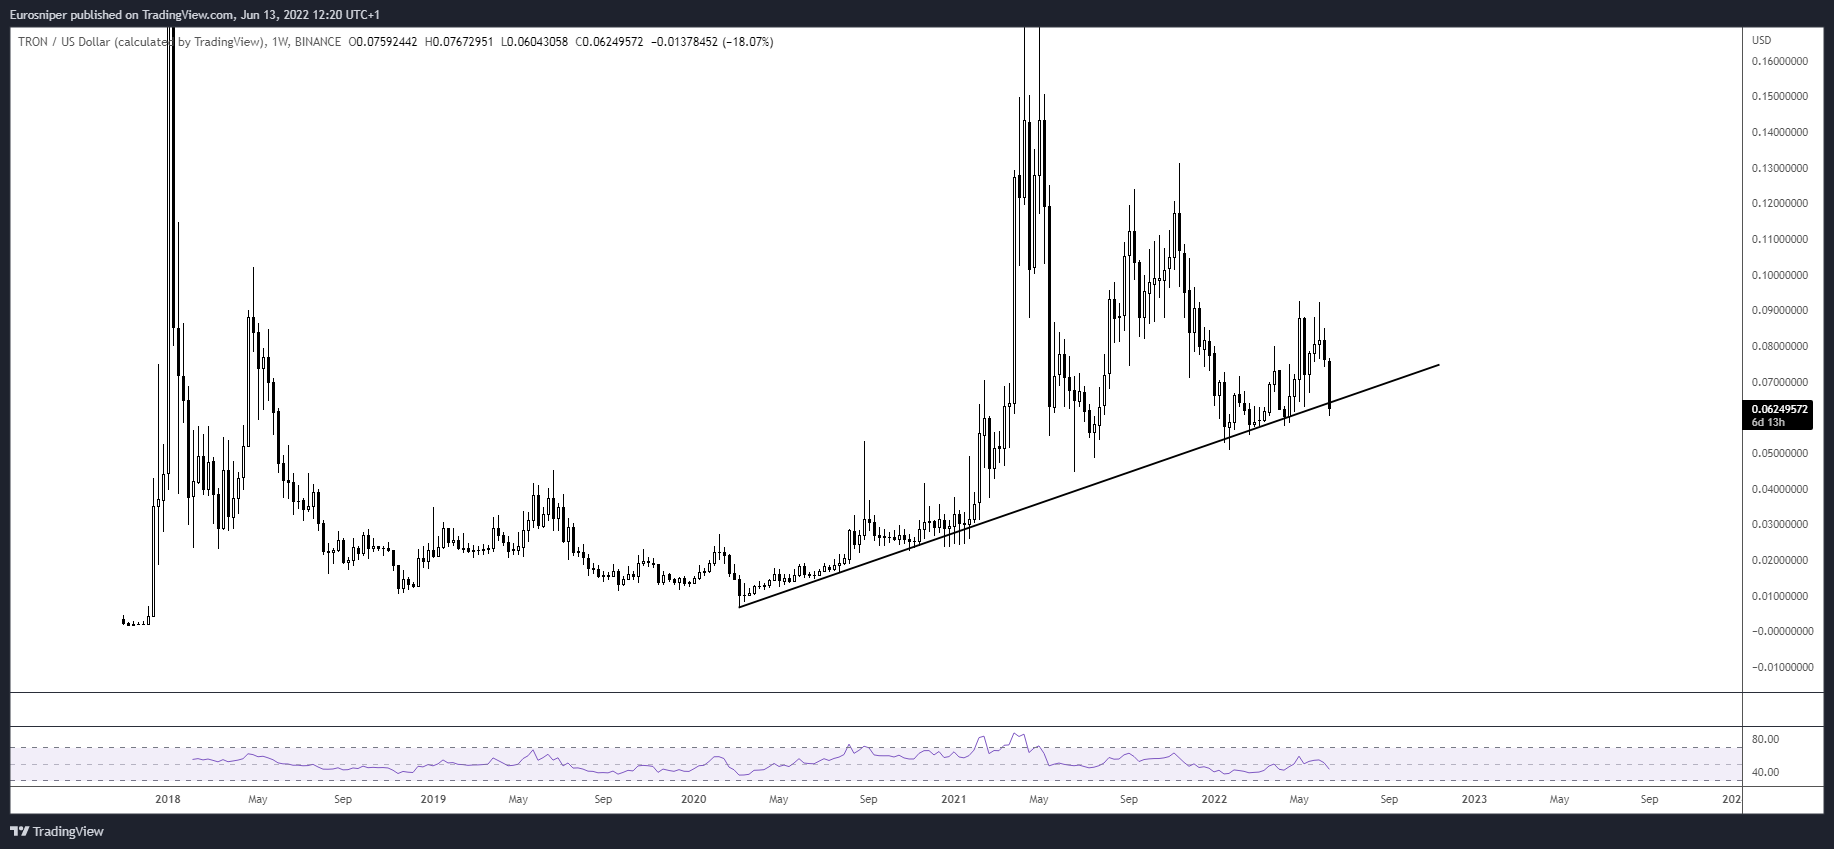
Cryptocurrency trader @TheEuroSniper tweeted a chart of TRX which shows a potential long-term ascending support line breaking. The line coincides with that which is outlined above.
Ongoing breakdown
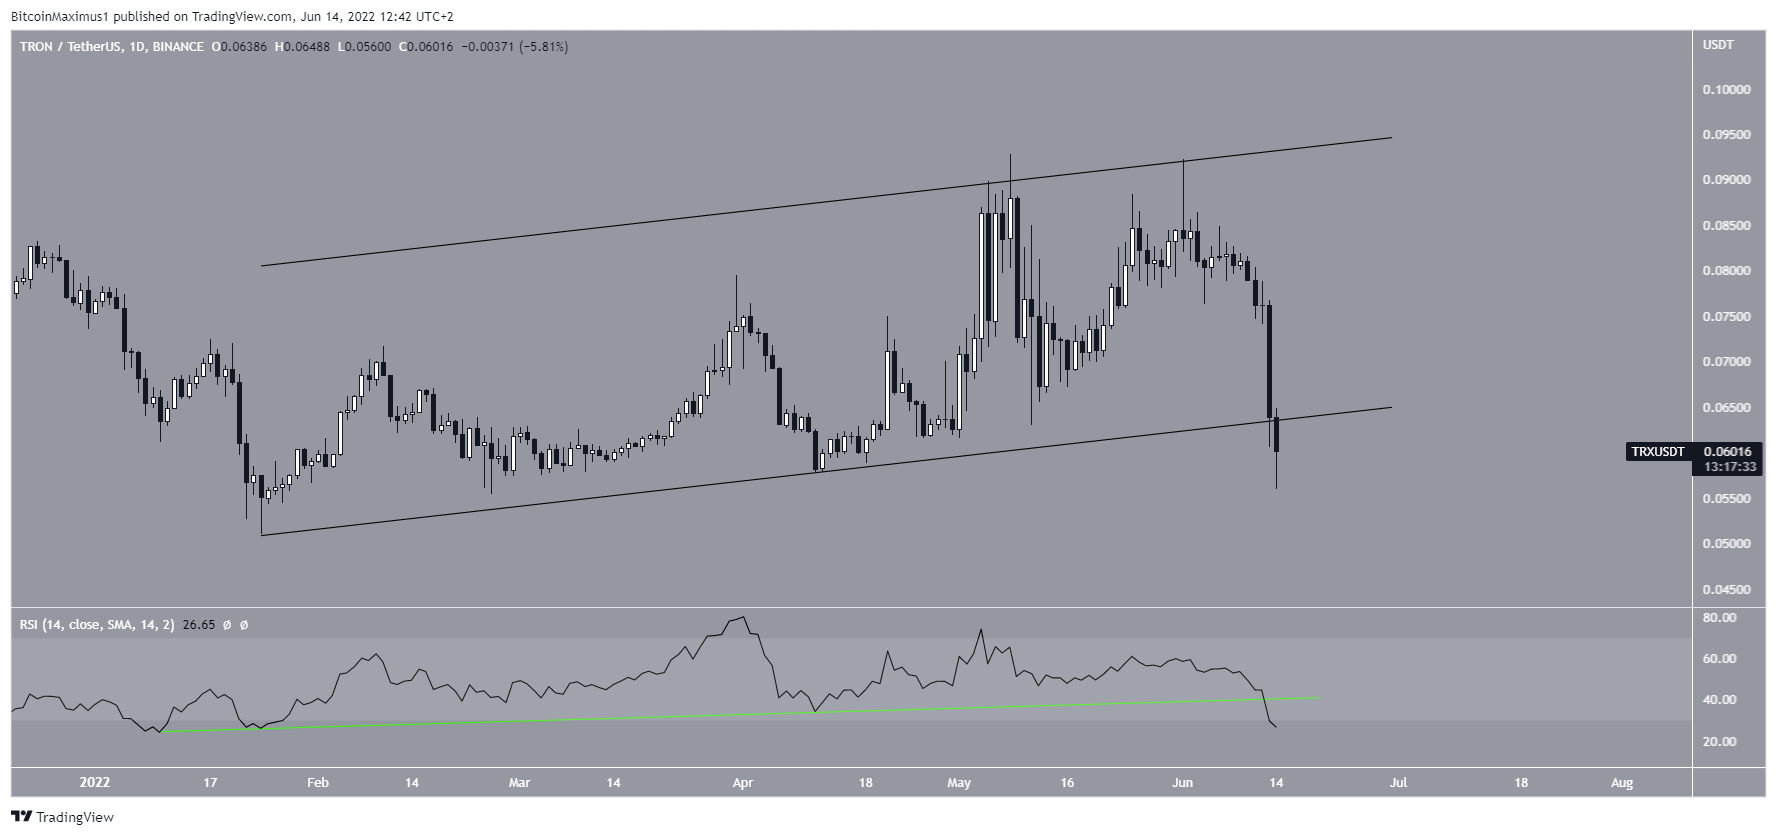
Similarly to the weekly, the daily time frame provides a bearish outlook. It shows that TRX has broken out from an ascending parallel channel. Such channels usually contain corrective movements, meaning that a breakdown from them is expected.
To further exacerbate the issue, the daily RSI has also broken down from an ascending support line (green), confirming the validity of the channel breakdown.
Short-term TRX movement
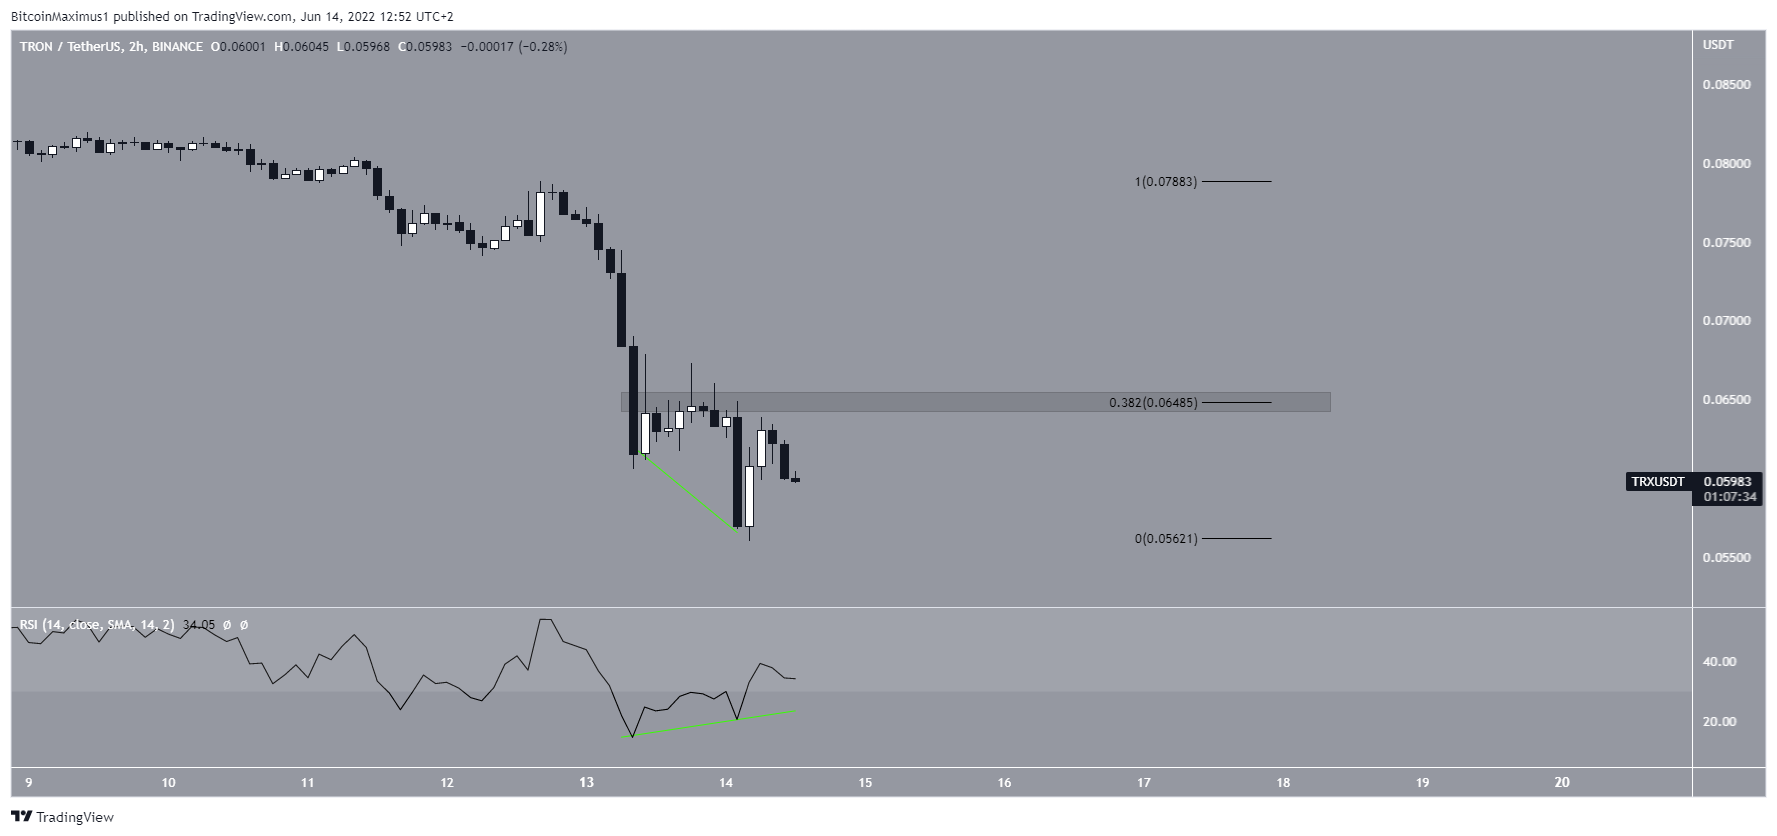
SponsoredDespite the bearishness from the weekly and daily time frames, the two-hour chart suggests that a bounce could occur soon.
The main reason for this is the bullish divergence that has developed in the two-hour RSI, which also moved outside of its oversold region.
If the upward movement continues, the closest resistance area would be at $0.065, the 0.382 Fib retracement resistance level, and a horizontal resistance area. The level also coincides with the support line from the previously outlined channel.
After it is reached, another downward movement could follow.
For Be[in]Crypto’s latest bitcoin (BTC) analysis, click here
