Despite Bitcoin’s relatively high market dominance as of late, there are still a handful of altcoins that are showing potential for growth.
Quant (QNT) has broken out from a long-term descending resistance line and validated it as support. MATIC is attempting to move above an important resistance level but has thus far been unsuccessful.
Matic Network (MATIC)
SponsoredCryptocurrency trader @CryptoMichNL outlined a MATIC chart, showing that the price has moved above a crucial resistance area and possibly validated it as support. He has given two resistance targets for further upward movement, found at 244 and 272 satoshis.
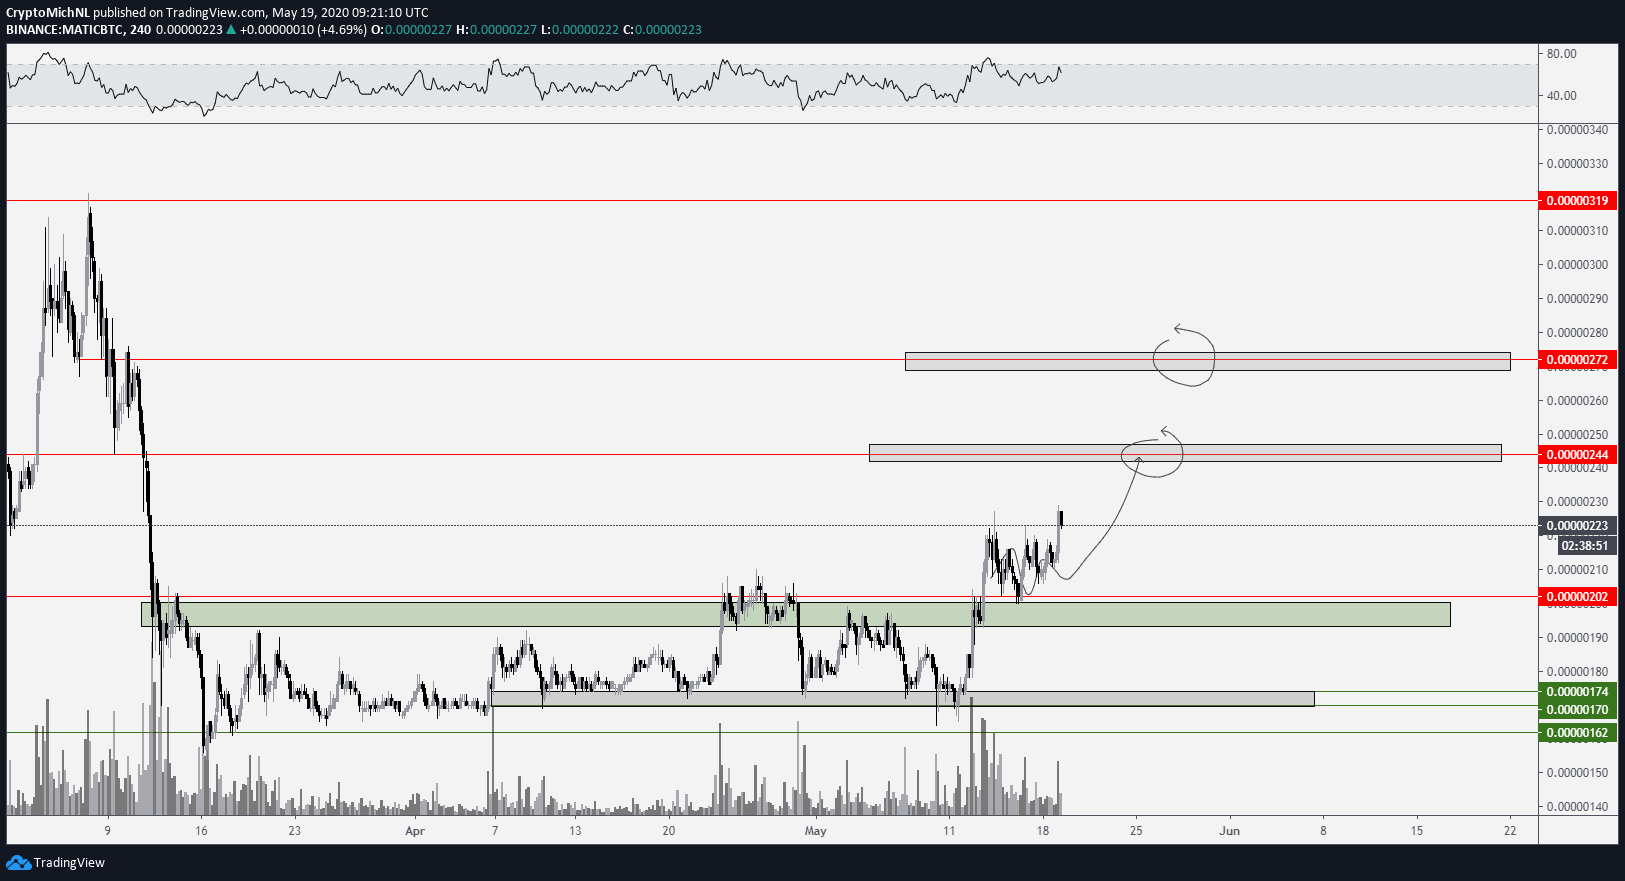
At the time of writing, MATIC was trading very near important resistance levels.
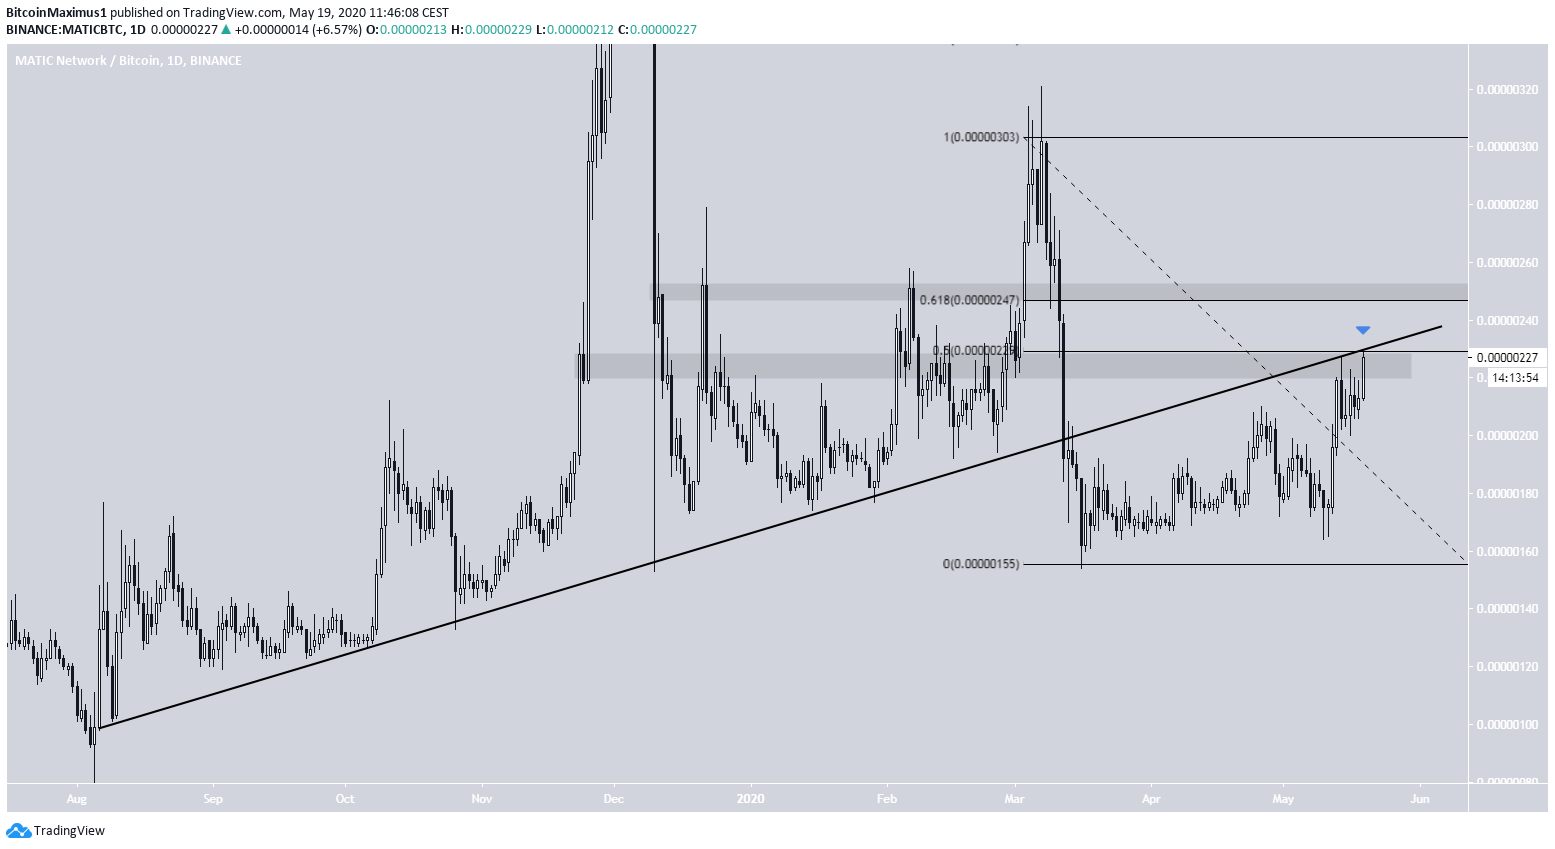
First, there is the long-term ascending support line, from which the price broke down on March 13. Currently, the price is directly under this resistance.
Sponsored SponsoredSecond, there is the 225 satoshis level which previously acted as support. This is also the 0.5 Fibonacci level of the previous downward move.
Beyond this, there is also a strong resistance level at 250 satoshis, a previous resistance area as well as the 0.618 fib level.
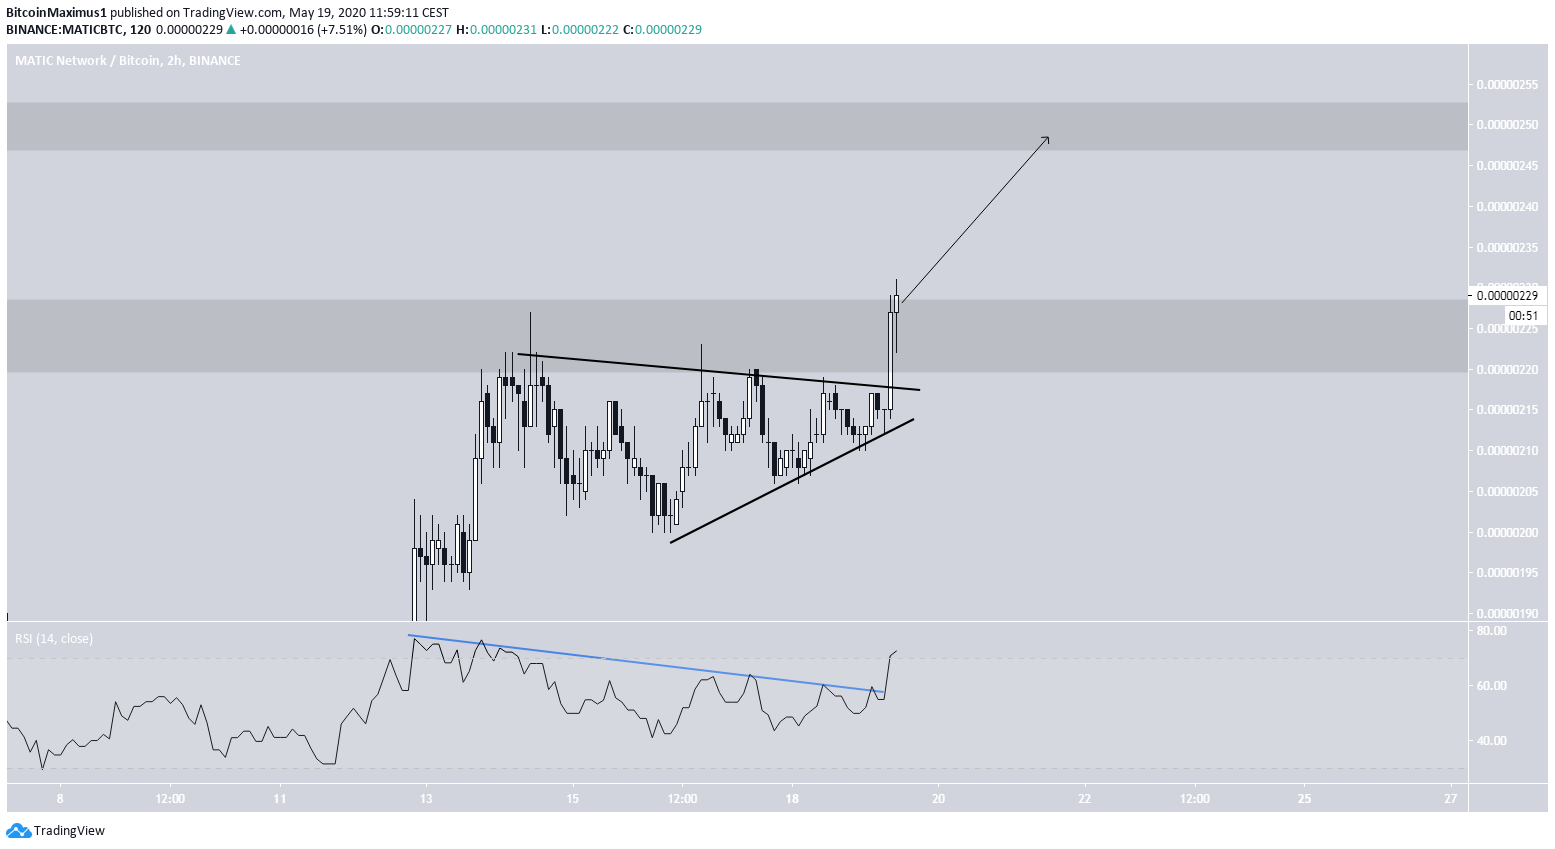
In the short-term, the MATIC price has broken out from a symmetrical triangle. In addition, the RSI has broken the bearish divergence trendline.
This is a sign that the price is likely to move upwards towards the 250 satoshi resistance area outlined previously.
Quant (QNT)
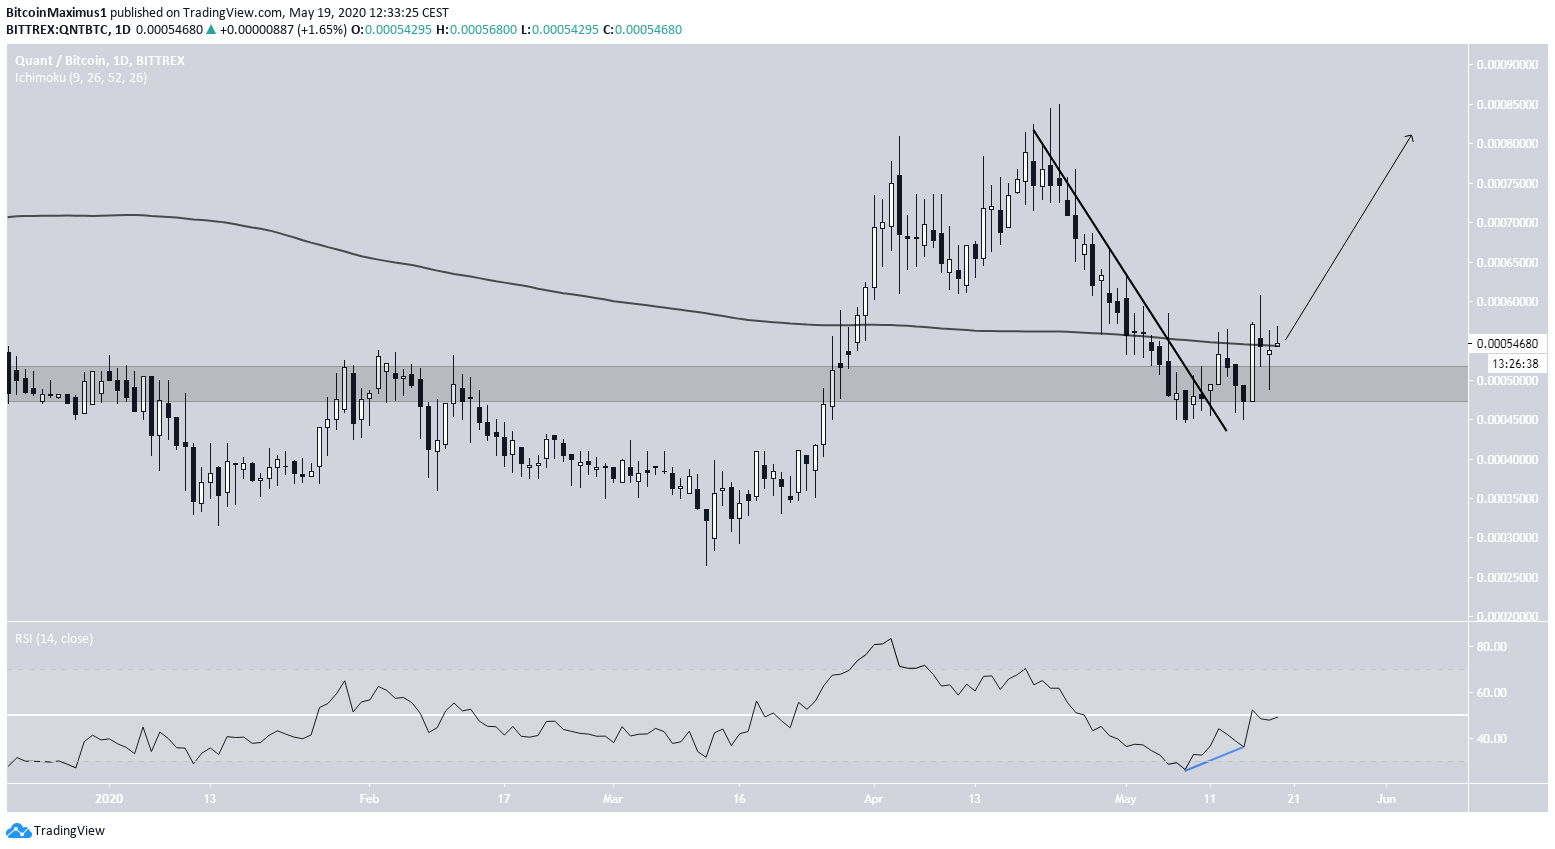
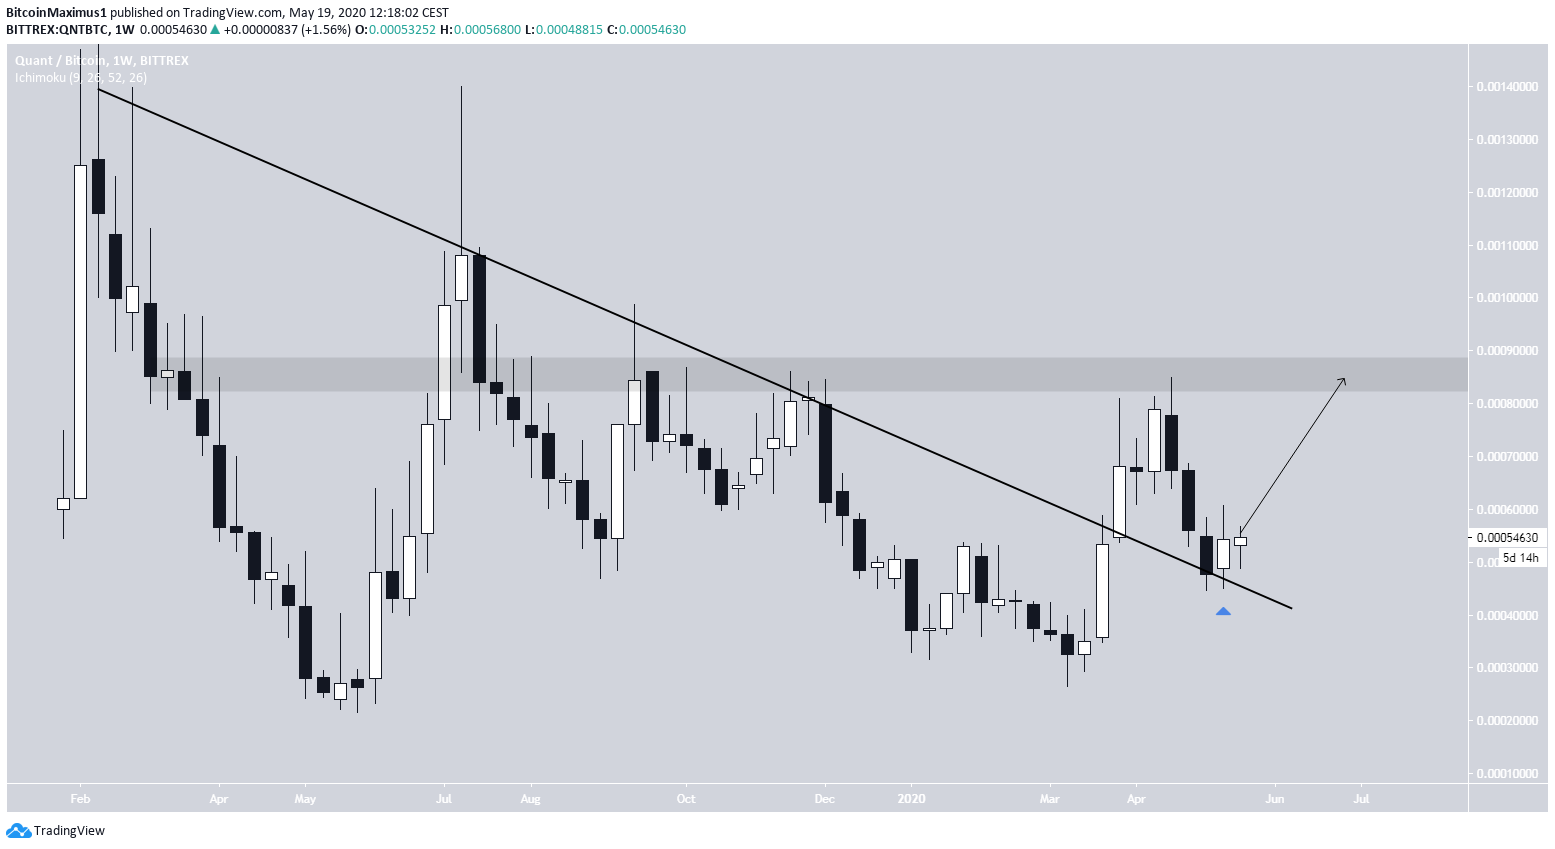
SponsoredOne other coin that has significant breakout potential is QNT. On March 30, the price broke out from a long-term descending resistance line that had been in place since February 2019.
Afterward, the price returned in order to validate this line as support. If it begins moving upwards, as is customary, the closest resistance area would be found at 86,000 satoshis.
The price has also broken out from a shorter-term descending resistance line. The outlook from the daily chart is bullish.
QNT has created a double-bottom inside the 50,000 satoshi support area, which is combined with bullish divergence. If the price successfully reclaims the 200-day moving average (MA), it is likely to continue its upward movement towards the resistance area previously outlined.