
In this article, BeInCrypto will take a look at the seven cryptocurrencies that increased the most over the past week, more specifically from Dec 17 – 24.
These altcoins are:
- Near Protocol (NEAR) : 67.20%
- Dogelon Mars (ELON) : 57.41%
- Terra (LUNA) : 55.23%
- Aave (AAVE) : 47.86%
- Fantom (FTM) : 41.54%
- Curve Dao Token (CRV) : 39.79%
- SushiSwap (SUSHI) : 33.24%
NEAR
On Dec 15, NEAR broke out from a descending resistance line and reached a new all-time high price of $17.50.
SponsoredHowever, it created a long upper wick the same day and fell back below this line.
Afterwards, it initiated another upward movement and broke out from both the resistance line and the $12.20 resistance area on Dec 23. It is now approaching its all-time high price.
It is possible that NEAR could increase towards $23.

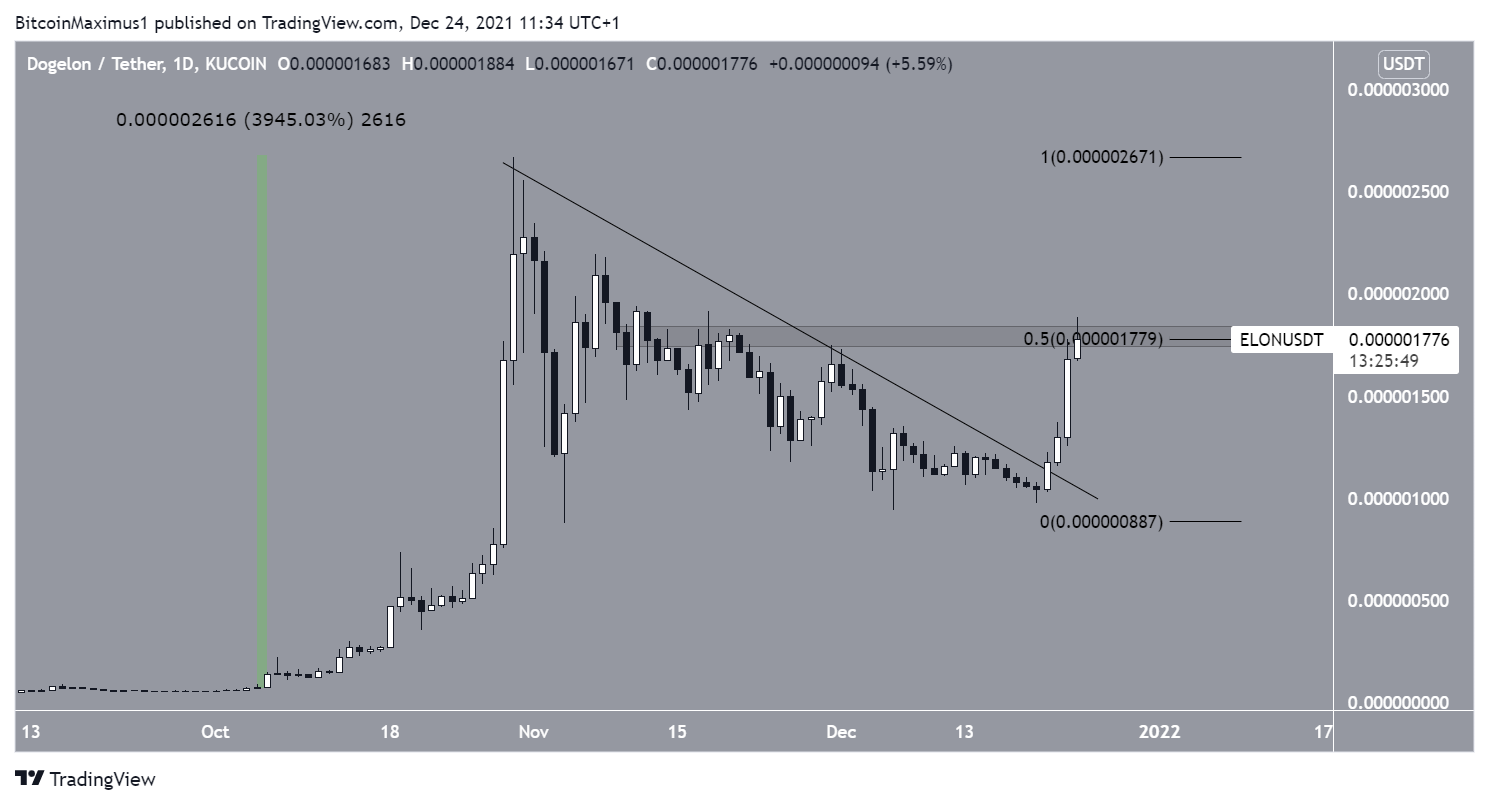
ELON
Since the beginning of Oct, ELON was subject to a rapid upward movement that led to an all-time high price of $0.0000026 on Oct 30.
Afterwards, it decreased alongside a descending resistance line, falling to a low of $0.00000093 on Dec 6.
It has been moving upwards since, and broke out from the descending resistance line on Dec 21.
Currently, it is trying to move above the $0.0000018 resistance area, which is the 0.5 Fib retracement resistance level.
LUNA
LUNA has been moving upwards at an accelerated rate since Dec 14. On Dec 22, it reached a then all-time high price of $98.20. The high was made just above the 1.61 external Fib retracement (black) when measuring the most recent drop.
After an initial rejection, LUNA regained its footing and initiated another upward movement. This led to a new all-time high of $101.2 on Dec 24.
The next closest resistance area is between $116-$120, created by the 2.61 external Fib retracement (black) and the 1.61 ratio of the previous upward movement (white).

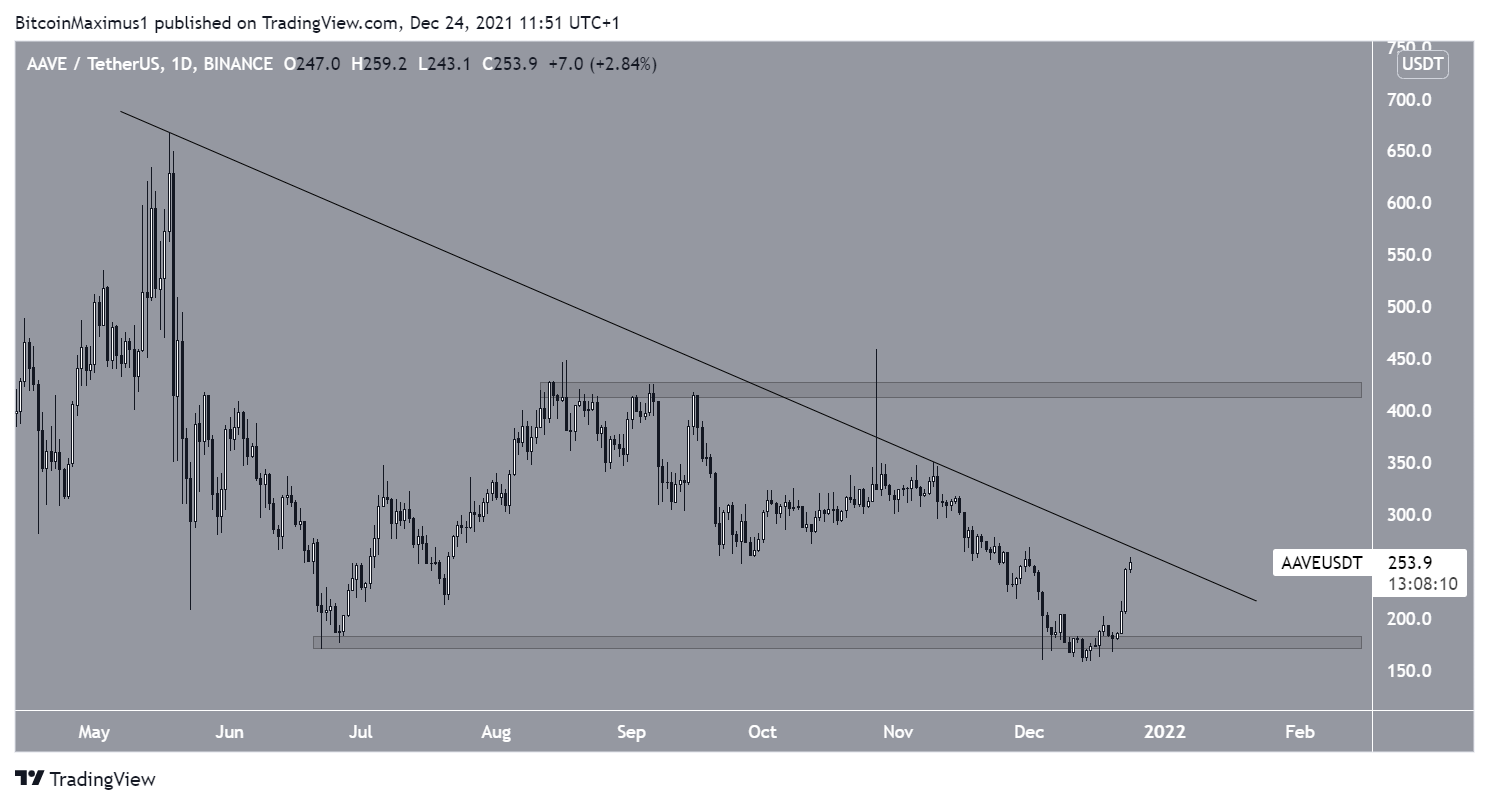
AAVE
On Dec 14, AAVE fell slightly below the $176 horizontal support area. The previous time it had fallen to this level was in late June.
While it initially seemed that the token would break down, AAVE created a double bottom and has been moving upwards since.
Currently, it has reached a descending resistance line in place since May.
SponsoredIf it is successful in moving above it, the next resistance would be at $422.
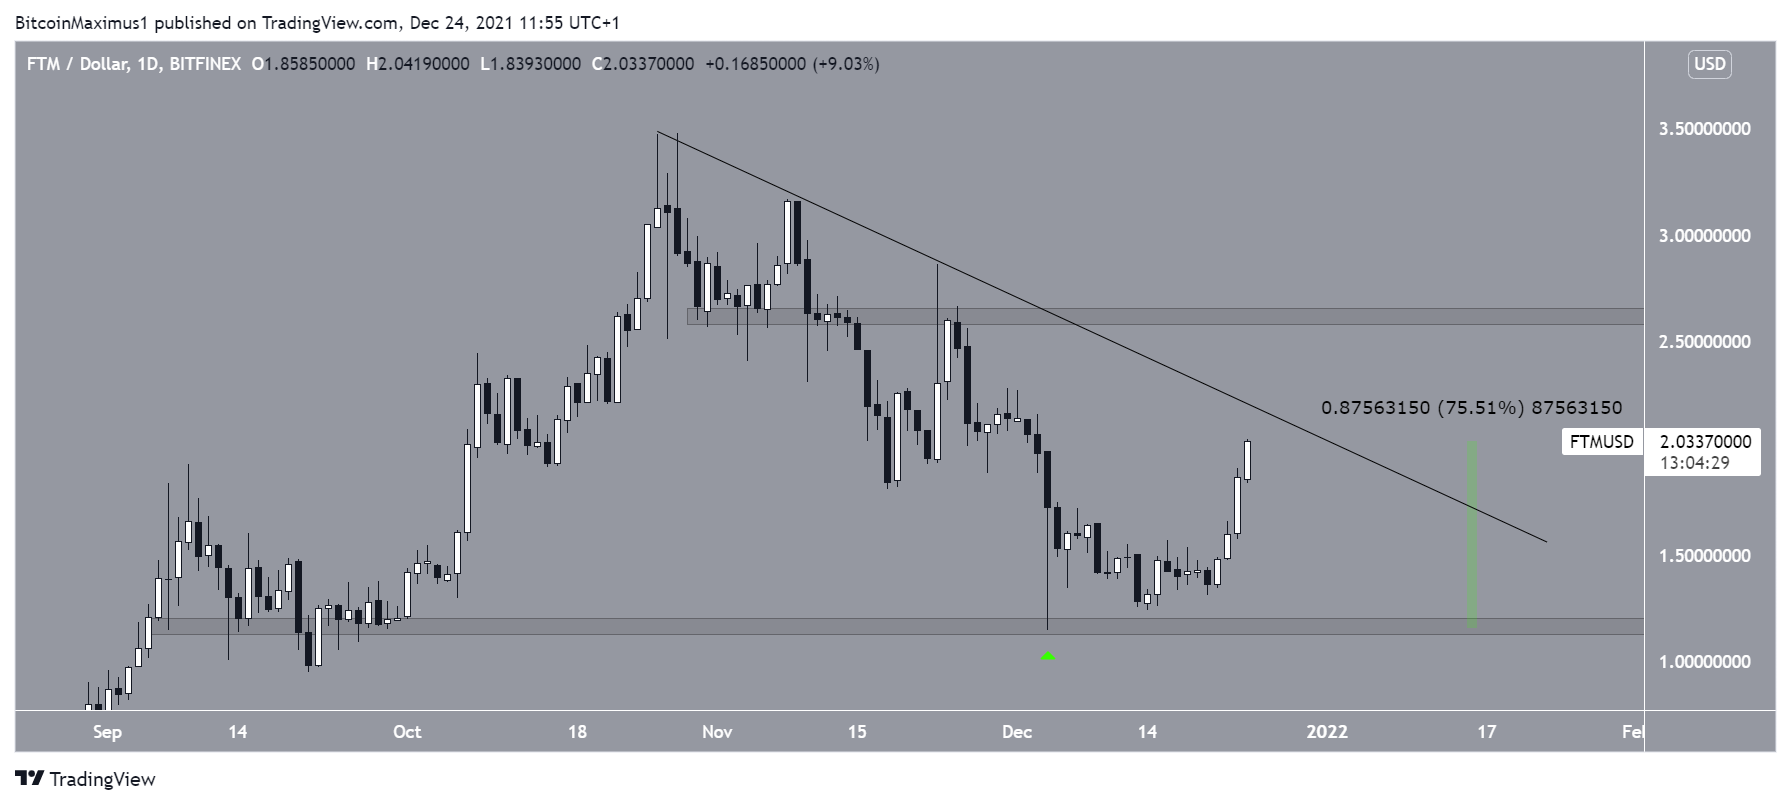
FTM
On Dec 4, FTM reached a low of $1.14 and bounced. The low served to validate the $1.15 horizontal area as support.
Since then, FTM has been moving upwards and so far has increased by 75%.
Similarly to AAVE, it is following a descending resistance line, which is currently at $2.10.
A breakout from this line would likely take the token towards the $2.60 horizontal area.
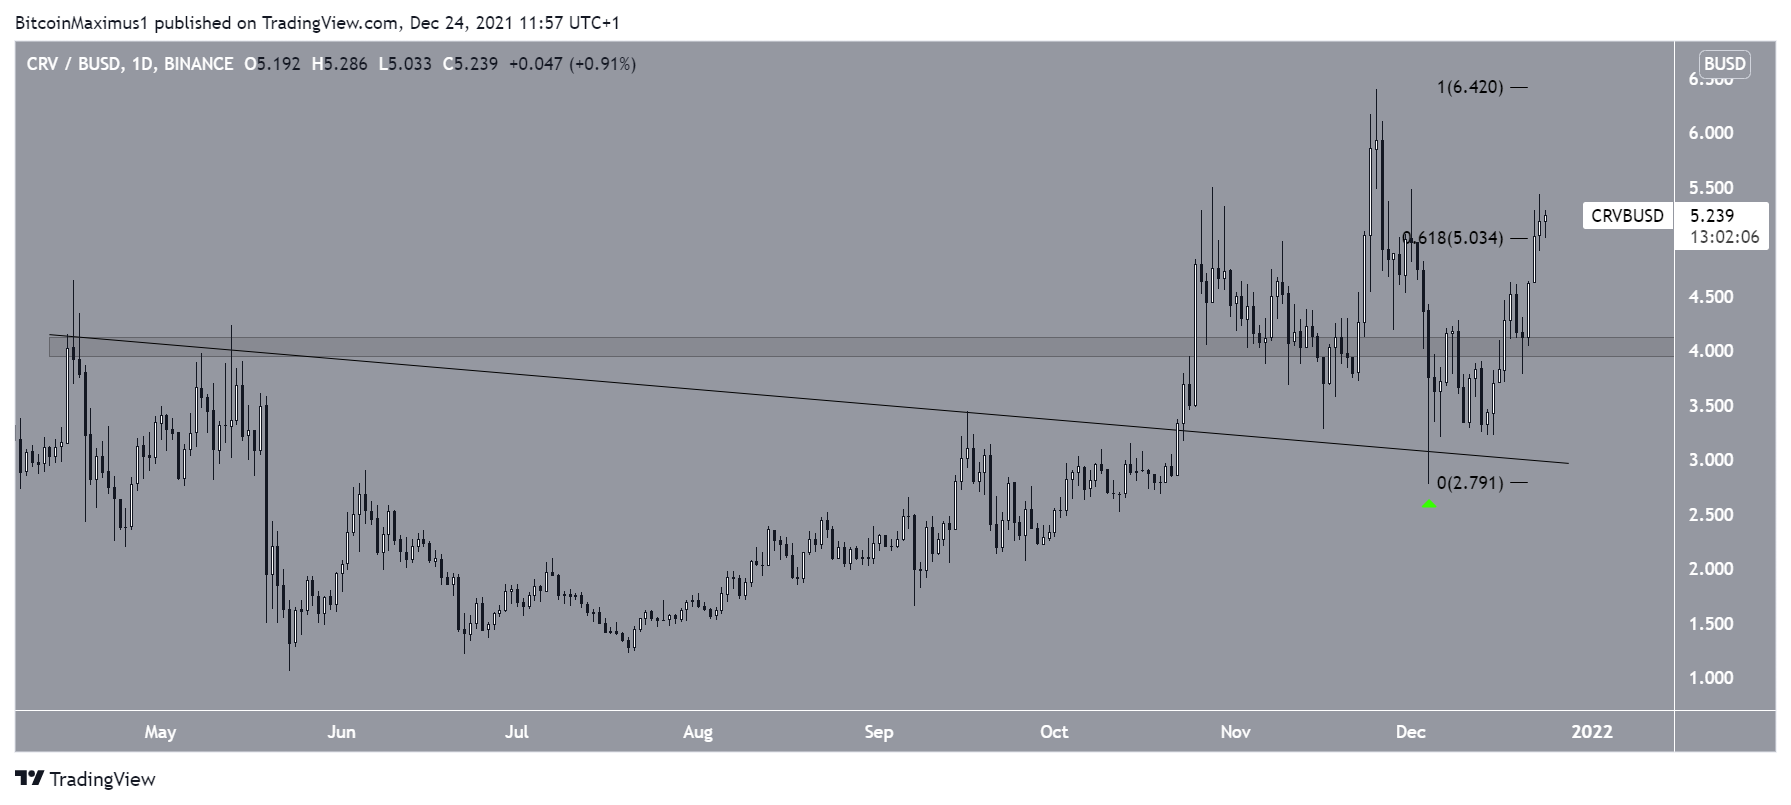
CRV
On Dec 4, CRV bounced at the previous descending resistance line, validating it as support (green icon). It has been moving upwards since and reclaimed the $4.05 horizontal area shortly afterwards.
Currently, it is attempting to move above the 0.618 Fib retracement resistance level at $5.03. If it is successful in doing so, it is likely to increase towards a new all-time high price.
SUSHI
SUSHI has been decreasing alongside a descending resistance line since the May 23 all-time high. This led to a low of $4.33 on Dec 4.
Similarly to AAVE, it initially seemed that SUSHI broke down below the $6.45 horizontal area.
However, it has reclaimed it since then and is currently approaching the descending resistance line near $8.50.

