
Status (SNT) returned to its May lows on June 14 and created a double bottom pattern that was combined with a bullish divergence in the RSI.
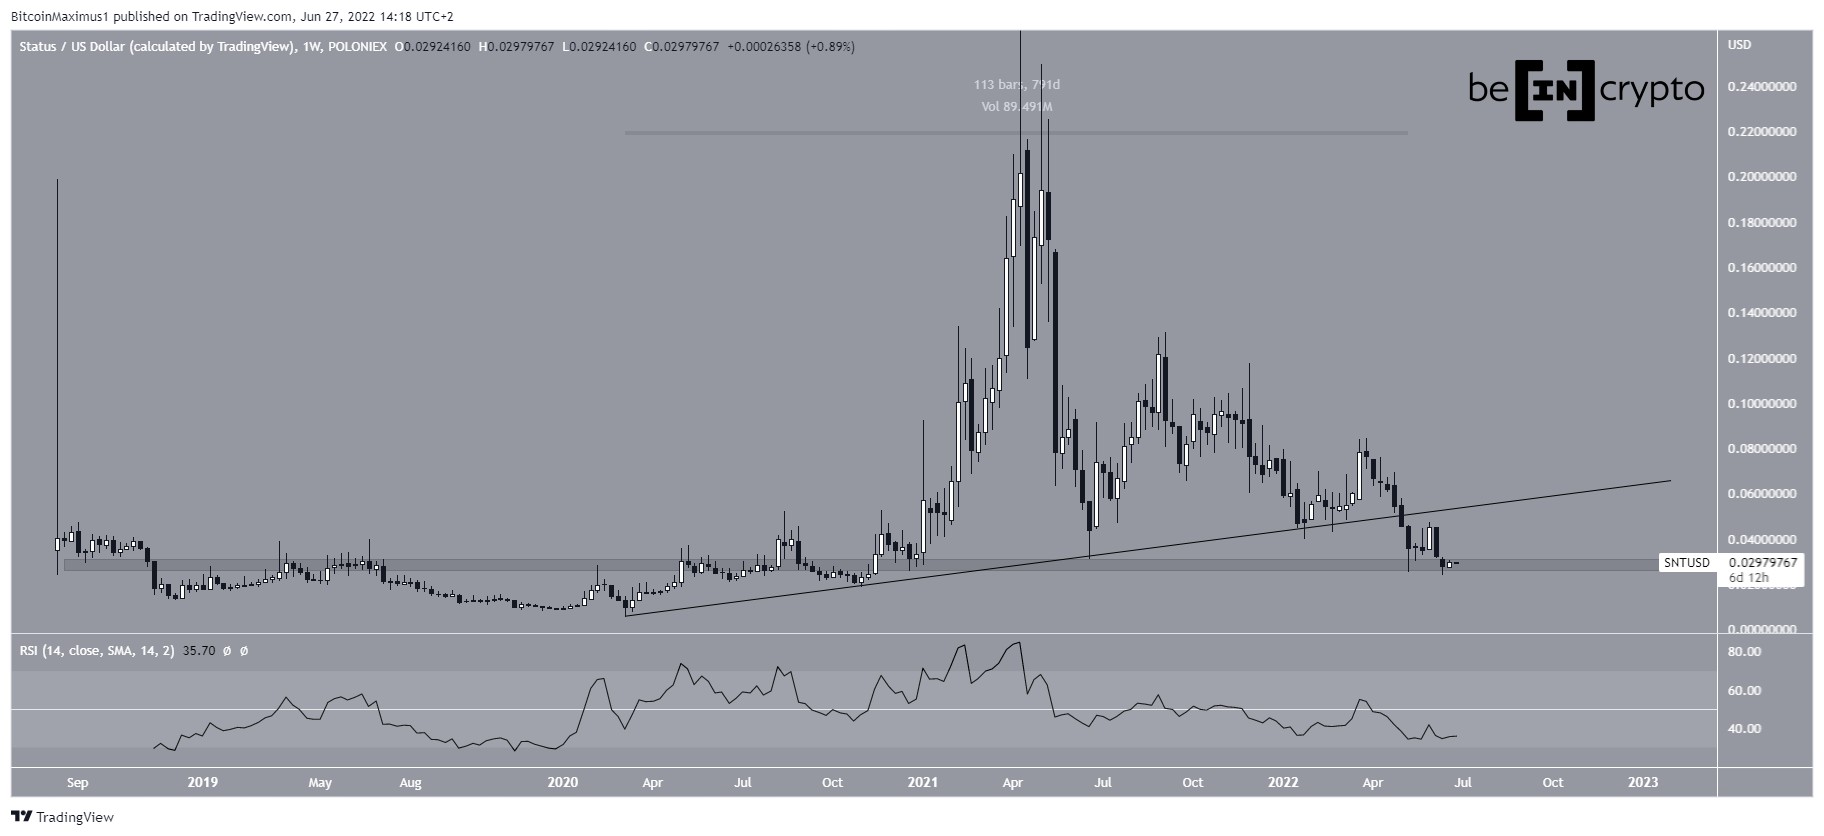
SNT has been falling since reaching an all-time high price of $0.293 on April 15, 2021. The downward movement has so far led to a low of $0.0239 on June 14, 2022.
SponsoredMore importantly, the decrease caused a breakdown from a long-term ascending support line in the beginning of May 2022. At the time of the breakdown, the line had been in place for 791 days.
Furthermore, the breakdown was combined with an RSI decrease below 50, which is considered a sign of bearish trends.
Currently, SNT is trading just above the $0.029 horizontal support area, which could still initiate a bounce.
Future movement
Cryptocurrency trader @Javonnnm tweeted a chart of SNT, stating that the price could increase all the way to $0.037 in the short term.
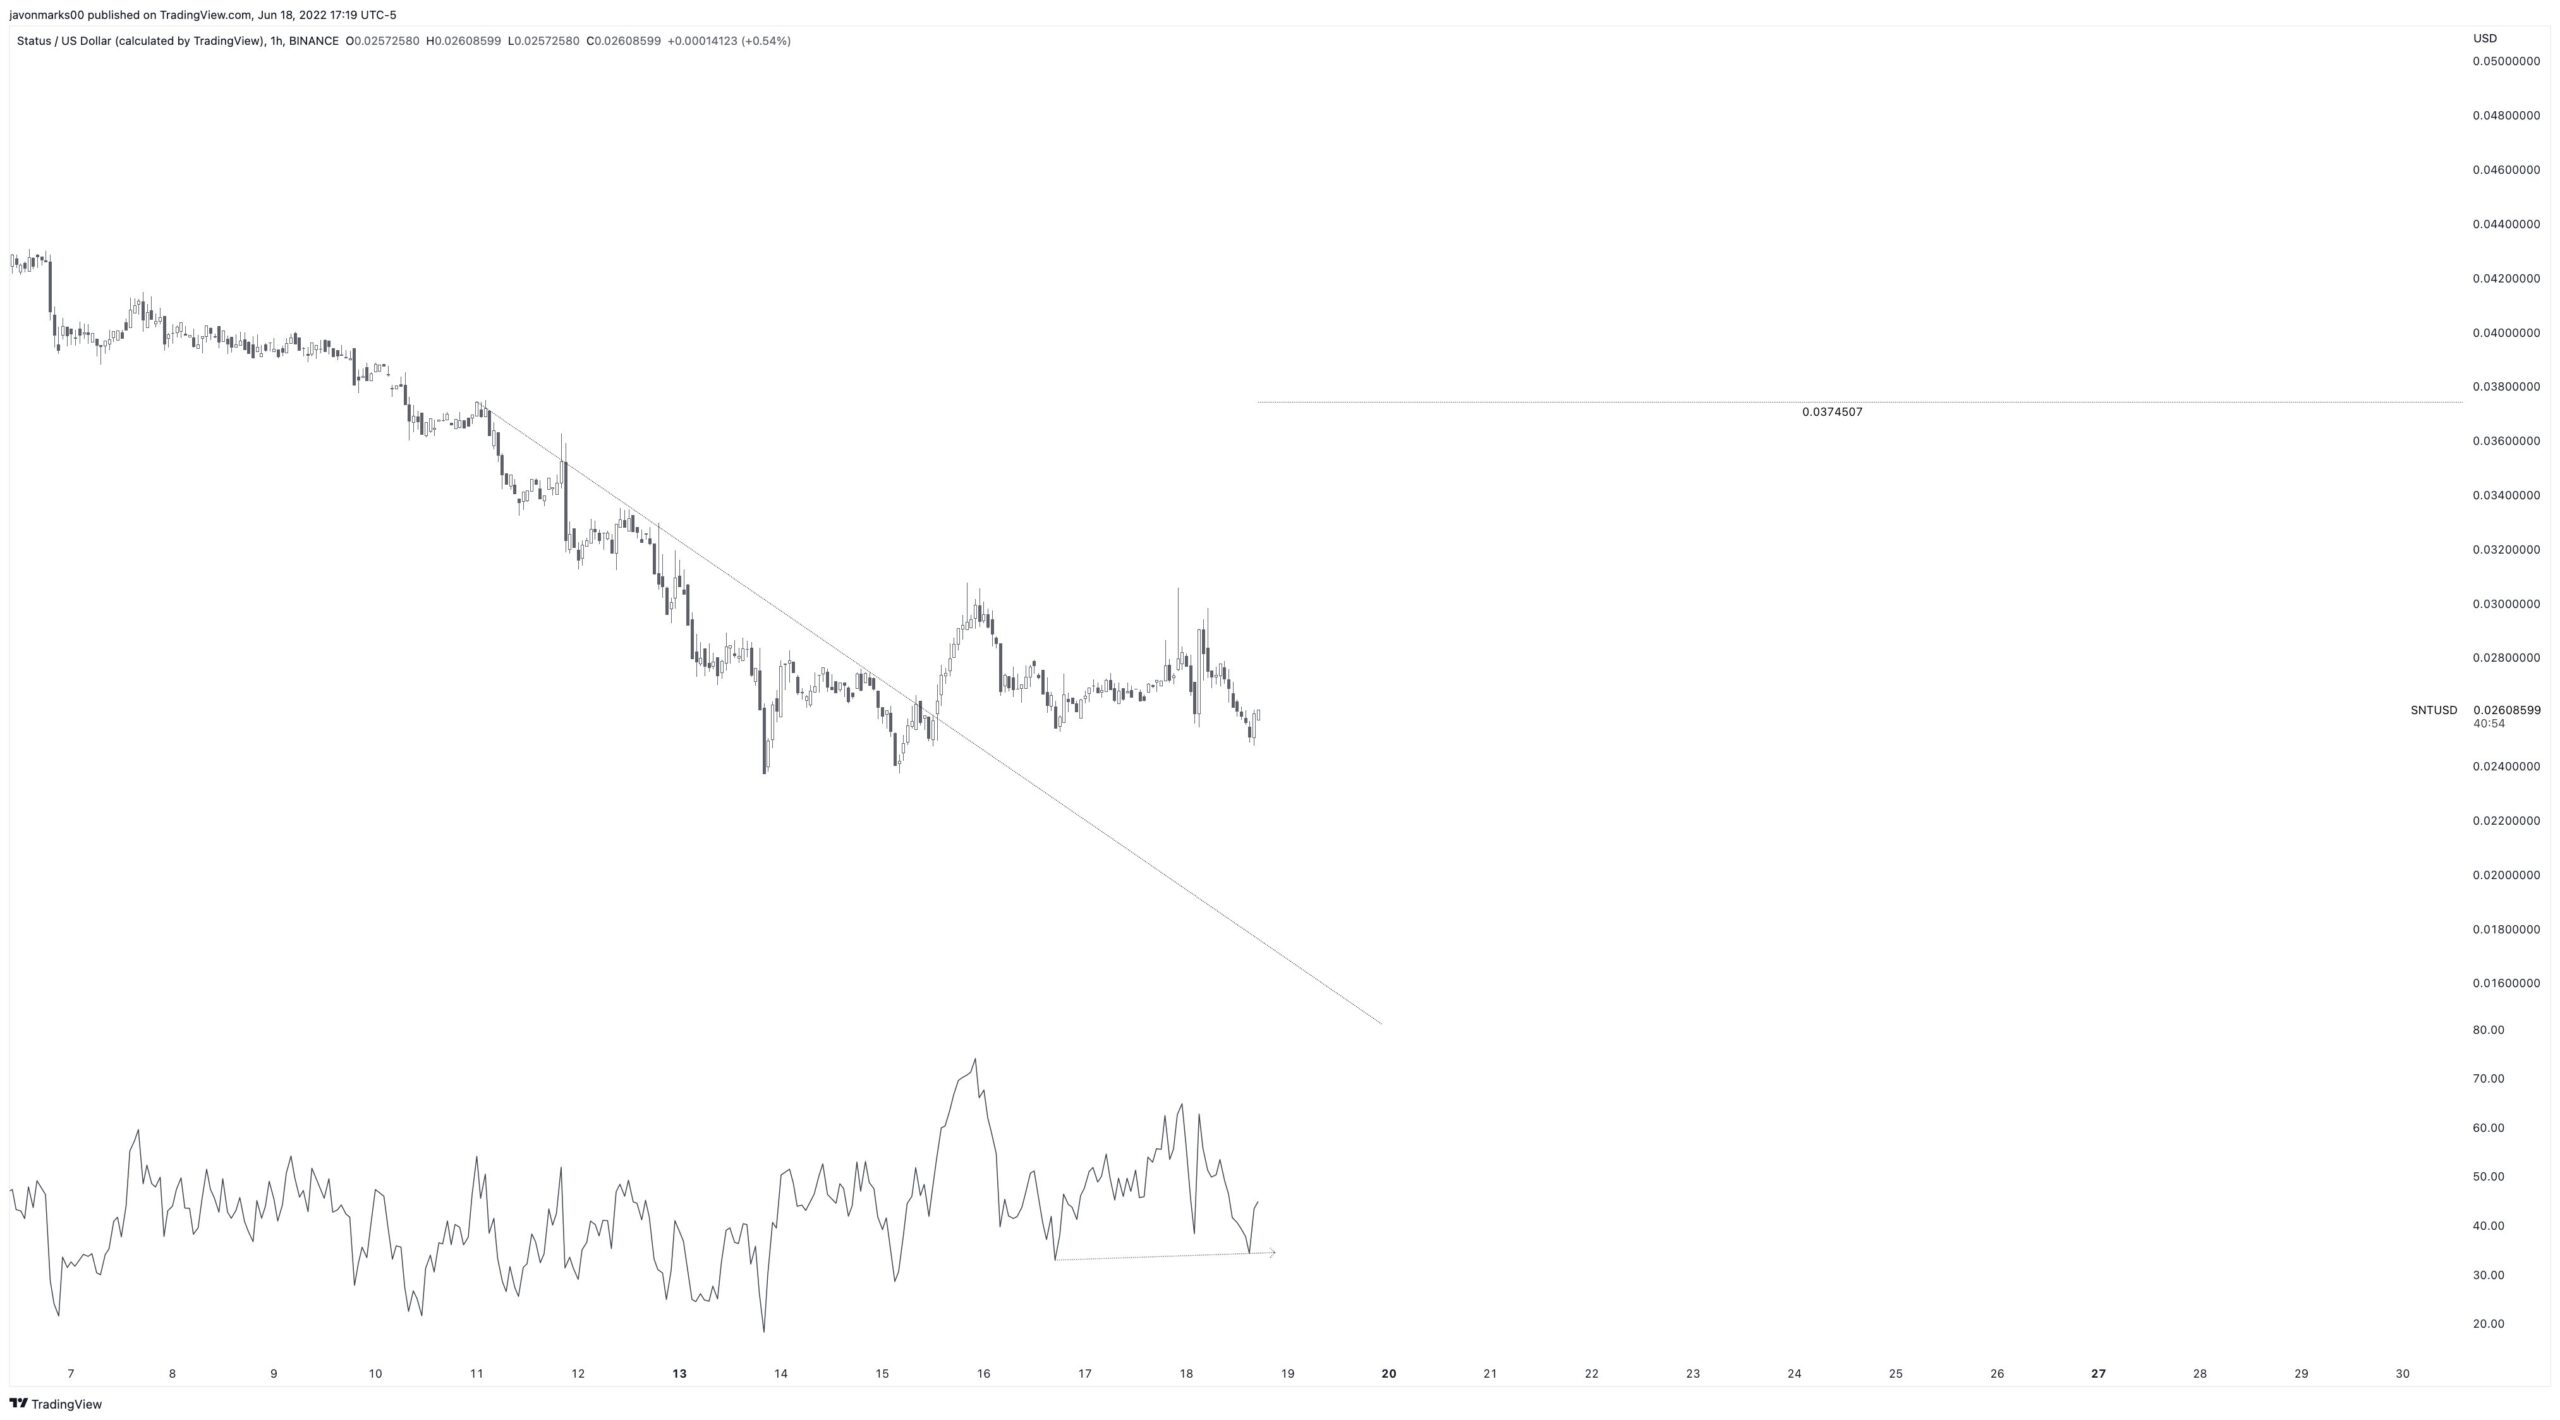
A closer look at the movement over the last two months shows the creation of a double bottom, which is considered a bullish pattern. The pattern was also combined with a bullish divergence in the daily RSI (green line).
So, it is possible that this will lead to a bullish trend reversal.
In case it does, there would be strong resistance at $0.05. The resistance would be created by a descending resistance line (dashed) and the previous long-term ascending support line.

SNT/BTC
The SNT/BTC chart shows that the price has been decreasing inside a descending parallel channel since the beginning of July 2021. Such channels usually contain corrective movements, meaning that a breakout from it would be likely.
Currently, the price is in the upper portion of the channel, further supporting this possibility.
If a breakout occurs, the next closest resistance would be at 250 satoshis.

For Be[in]Crypto’s latest bitcoin (BTC) analysis, click here
