
Solana (SOL) reached a new all-time high on Aug. 21 but has been moving downwards since.
The Graph (GRT) has broken out from both short- and a long-term descending resistance lines.
Waves (WAVES) has created a double top pattern inside the $26.80 resistance area.
SponsoredSOL
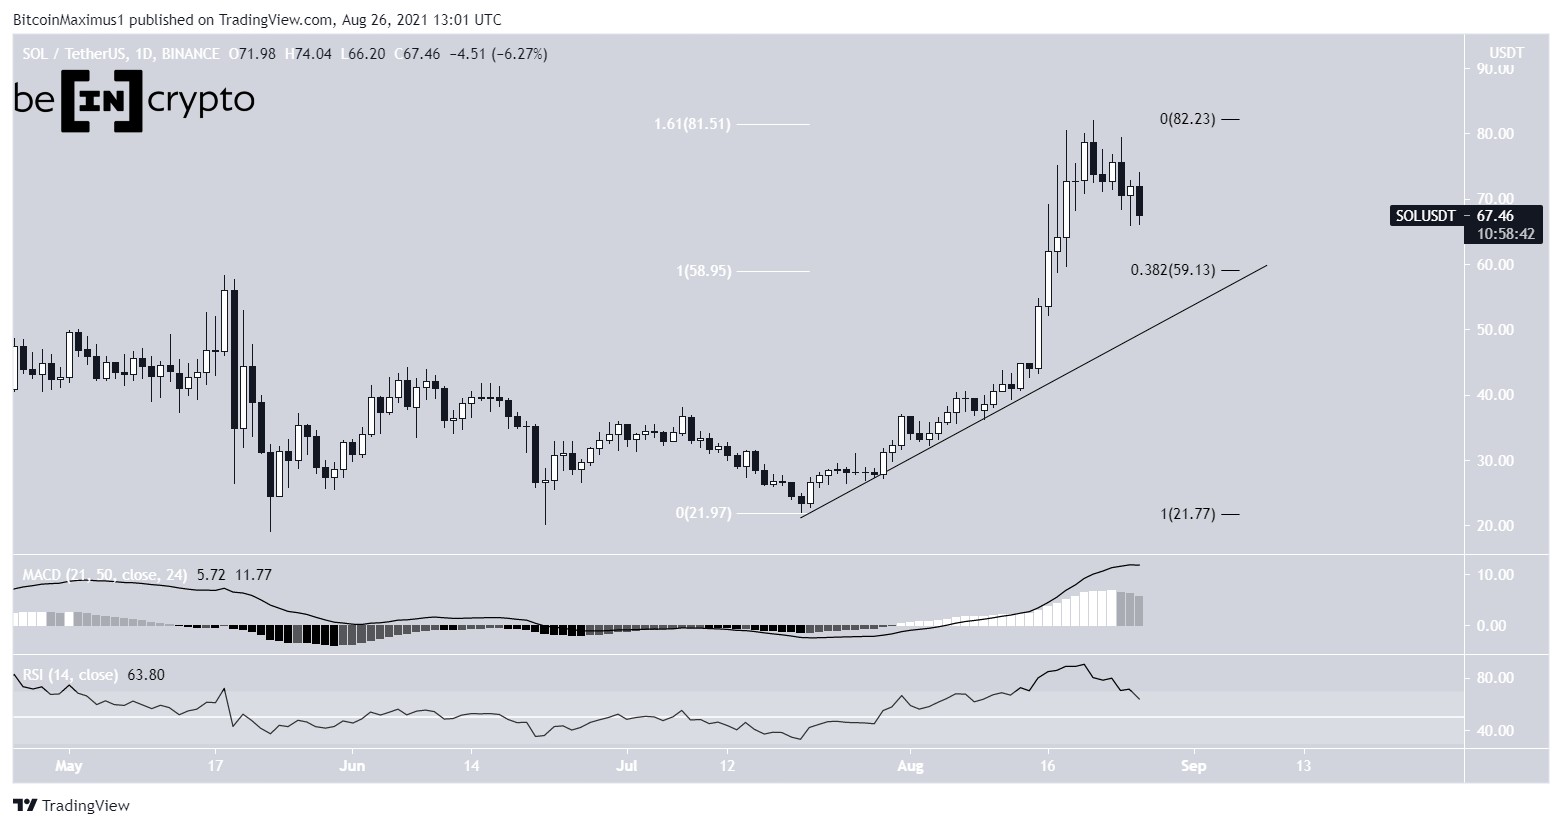
SOL has been moving upwards alongside an ascending support line since July 20. On Aug. 21 it reached a new all-time high price of $82.
The high was made right at the 1.61 external Fib retracement resistance level (white) when measuring the most recent portion of the downward movement.
SOL has been moving downwards since. Furthermore, the RSI has fallen below 70 and the MACD has given a bearish reversal signal.
The most likely support for the token to bounce is at $59. This is the 0.382 Fib retracement support level and coincides with an ascending support line.
Furthermore, it is the previous all-time high resistance area, which would be expected to act as support on a re-test.
Highlights
- SOL reached a new all-time high on Aug. 21.
- It is following an ascending support line.
GRT
GRT had been following a descending resistance line (dashed) since reaching an all-time high price on Feb. 12. While following, it proceeded to reach a low of $0.428 on June 22. It has been moving upwards since.
On Aug. 1, GRT managed to break out from another descending resistance line (solid), this one being in place since only June 3. The upward movement continued and GRT broke out from the longer-term descending resistance line on Aug. 12.
In addition to this, GRT also reclaimed the $0.,90 horizontal resistance area. However, the upward movement could not be sustained and the token has fallen below since. Furthermore, the MACD has given a bearish reversal signal and the RSI is close to decreasing below 50.
SponsoredIt seems that GRT is now attempting to find support. If so, the most likely area to provide support is between $0.685-$0.735, the 0.5-0.618 Fib retracement support levels. A re-test of this area would also re-test the previously outlined long-term descending resistance line.

Highlights
- GRT has broken out from a descending resistance line.
- There is support between $0.68-$0.75.
WAVES
WAVES has been increasing since July 20. On Aug. 11, it managed to break out from the $17.70 horizontal resistance area and proceeded to reach a high of $27.45 on Aug. 14. The high was made inside the 0.5 Fib retracement resistance level (black).
Sponsored SponsoredAfter a slight drop, the token made another attempt at breaking out. However, it created a double top pattern on Aug. 22 and has been moving downwards since. The bearish pattern was also combined with bearish divergence in the RSI.
If WAVES continues to drop, there is a potential ascending support line at $20. However, the main support area is at $17.70. This is also the 0.618 Fib retracement support level (white).
Sponsored Sponsored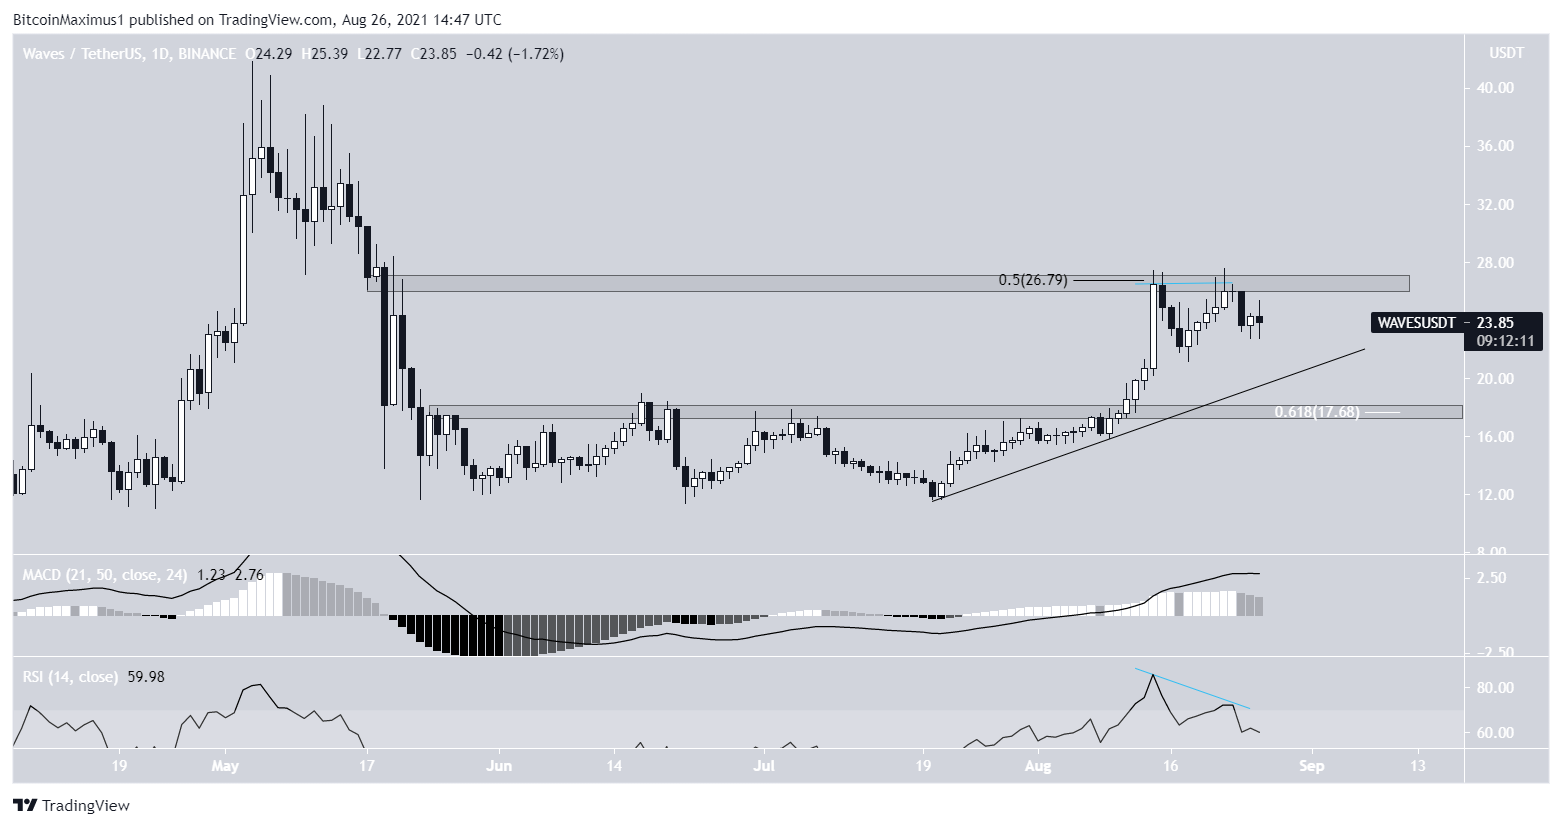
Highlights
- Waves has created a double top pattern.
- There is resistance and support at $26.80 and $18.
For BeInCrypto’s latest Bitcoin (BTC) analysis, click here.
