
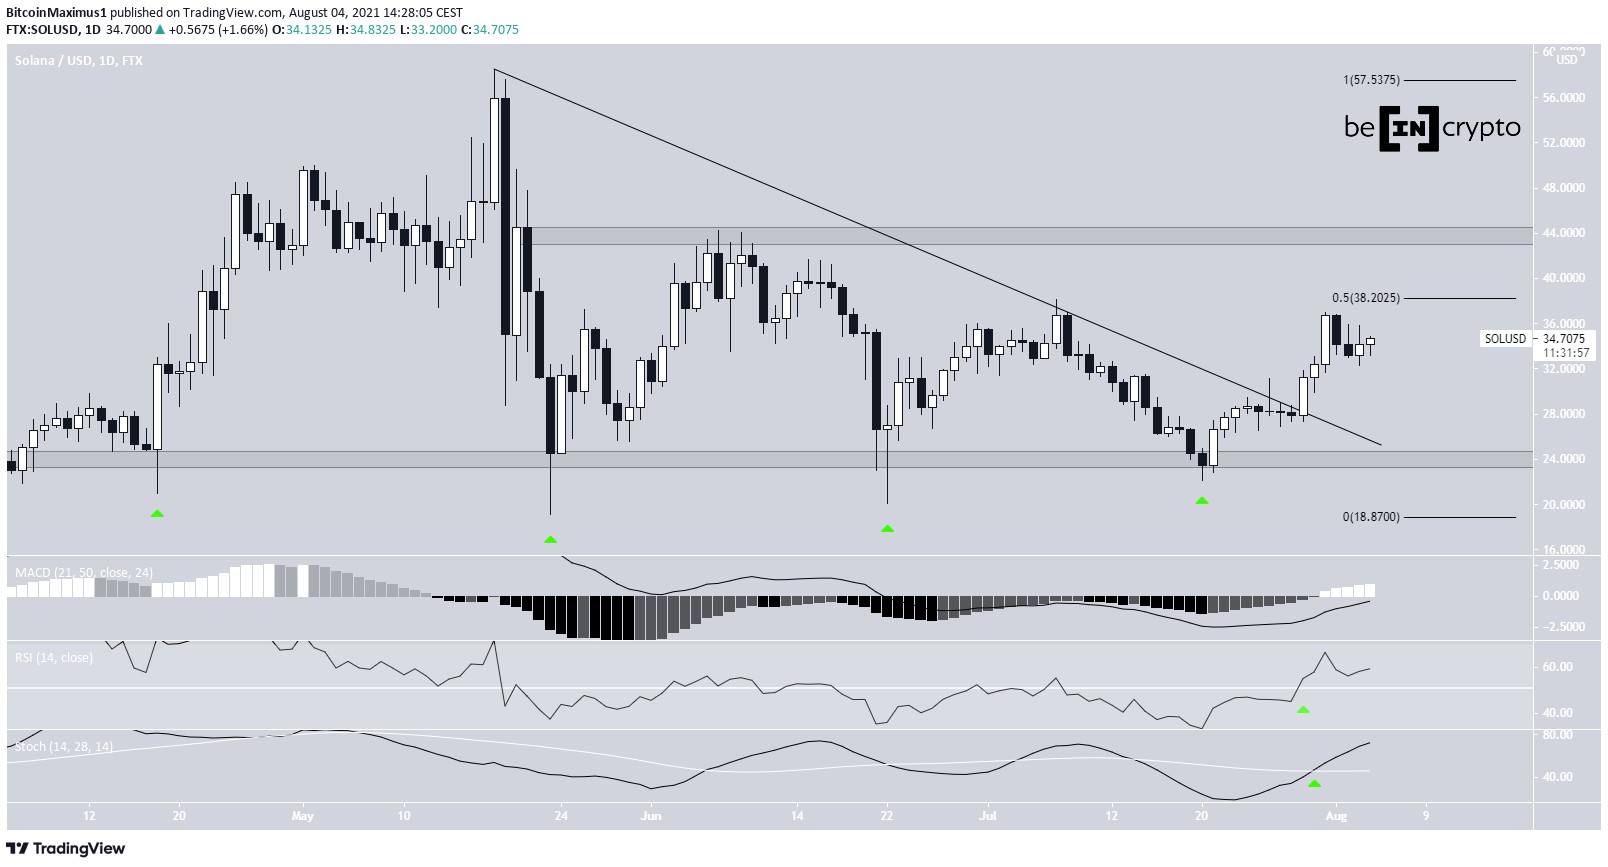
Solana (SOL) has broken out from a descending resistance line after bouncing at the $24 support area.
Serum (SRM) has been increasing since creating a double bottom pattern on July 20.
Terra (LUNA) has broken out from a descending resistance line and reclaimed the $11.80 horizontal area in the process.
SOL
SponsoredSince the beginning of the year, SOL has bounced at the $24 horizontal support area four times, doing so on:
- April 18
- May 23
- June 22
- July 20
After the final bounce, it initiated an upward movement that caused a breakout from a descending resistance line that had been in place since May 18.
So far, the token has managed to reach a high of $37, doing so on July 31. The high was made very close to the 0.5 Fib retracement resistance level at $38.
Technical indicators in the daily time-frame are bullish, supporting the continuation of the upward movement. The RSI has moved above 50, the Stochastic oscillator has made a bullish cross and the MACD is nearly positive.
If a breakout occurs, the next resistance would be at $43.50.
Highlights
Sponsored Sponsored- SOL has broken out from a descending resistance line.
- There is support and resistance at $24 and $43.5, respectively.
SRM
On June 21 and July 20, SRM created a double bottom pattern. The pattern was combined with bullish divergences in the MACD, RSI and Stochastic oscillator. Afterwards, it initiated an upward movement.
The token broke out above the $3.70 resistance area on July 31, and validated it as support two days later.
So far, it has managed to reach a high of $4.53, doing so on Aug. 4.
Technical indicators in the daily time-frame are bullish, supporting the continuation of the upward movement.
The next closest resistance area is at $5.40.
Sponsored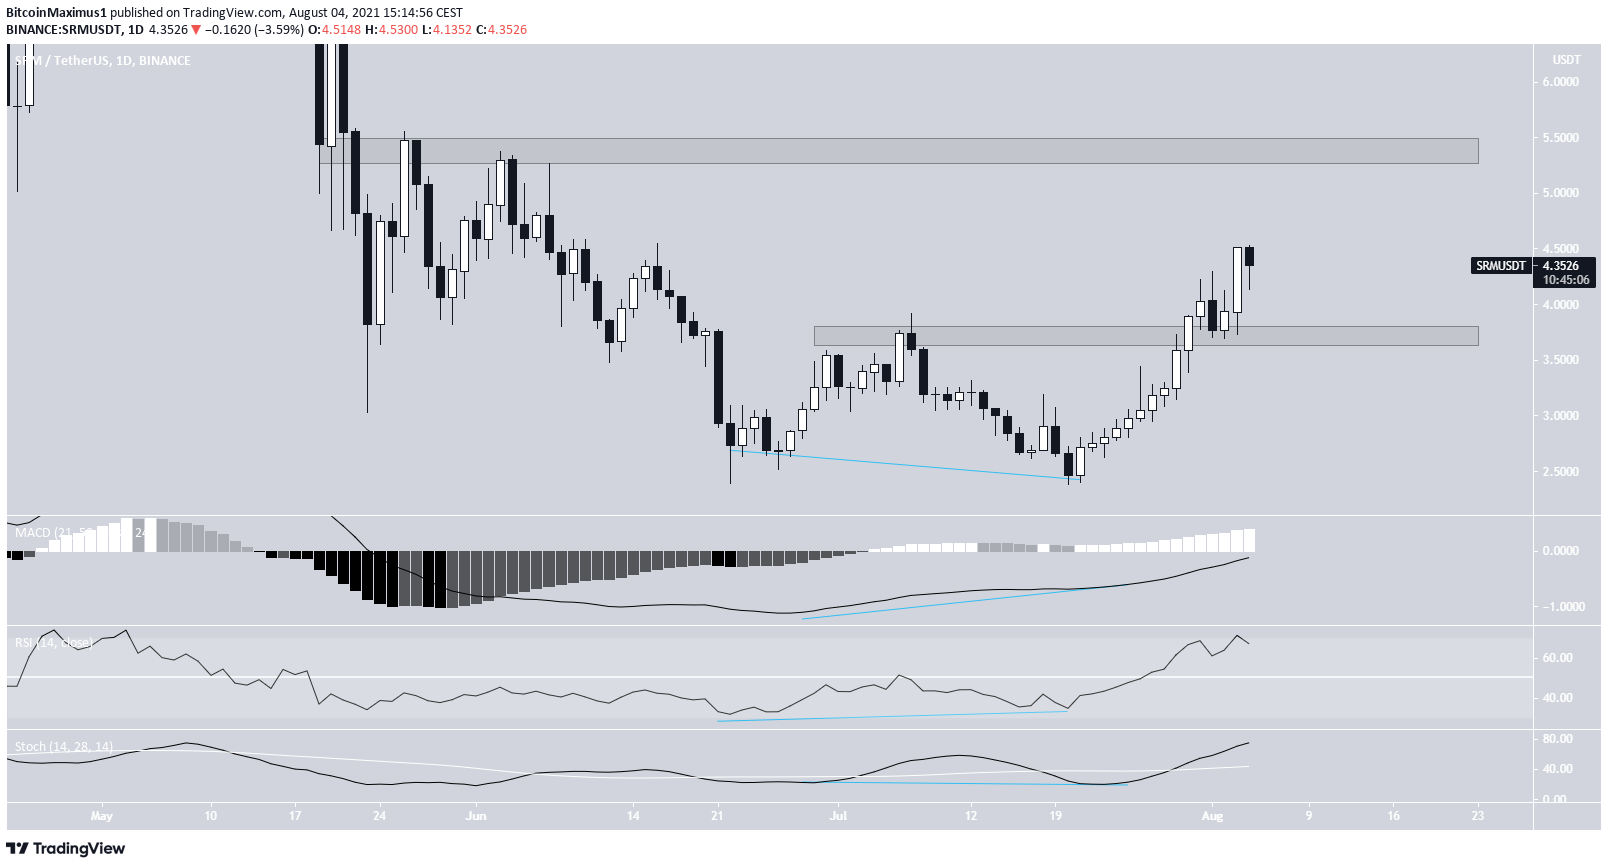
Highlights
- SRM has created a double bottom pattern.
- It has reclaimed the $3.60 horizontal area.
LUNA
LUNA had been following a descending resistance line since the March 21 high. This led to a low of $3.91 on May 23.
The ensuing upward movement was initially gradual, but accelerated on July 20.
Sponsored SponsoredThe token broke out from the descending resistance line on Aug. 1. The next day, it reclaimed the $11.80 horizontal resistance area.
So far, it has managed to reach a high of $15.05, doing so on Aug. 4.
Technical indicators in the daily time-frame are bullish. The MACD is increasing, the Stochastic oscillator has made a bullish cross and the RSI has moved above 70.
The next closest resistance area is at $17.80.
Sponsored Sponsored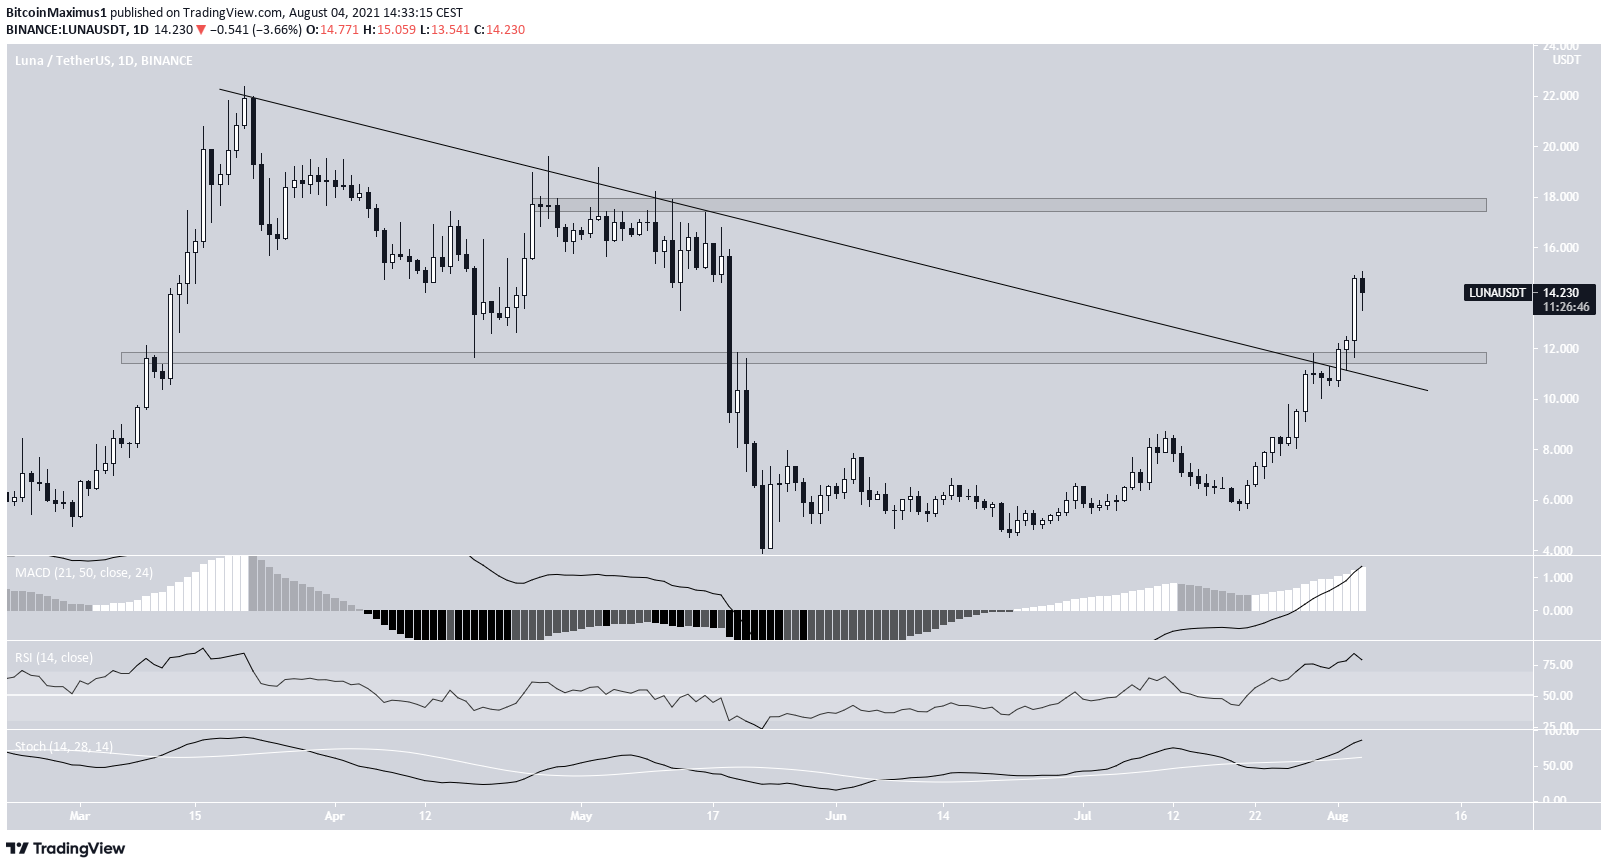
Highlights
- LUNA has broken out from a descending resistance line.
- It has reclaimed the $11.80 horizontal area.
For BeInCrypto’s previous bitcoin (BTC) analysis, click here.
