
Solana (SOL) has been increasing since bouncing, on May 23, and creating a long lower wick.
While it has shown numerous bullish reversal signs, it has yet to confirm the bullish trend reversal.
Ongoing SOL correction
SponsoredSOL has been falling since it reached an all-time high price of $53.58, on May 18. The decrease continued until May 23, culminating with a low of $19.10.
The price bounced afterwards and is in the process of creating a higher low on May 30 (green icon).
Technical indicators are neutral. While both the RSI and MACD are showing bullish reversal signs, the Stochastic oscillator is still falling.
The main support area is at $23, created by the 0.618 Fib retracement level. It is also a horizontal support level.
Sponsored Sponsored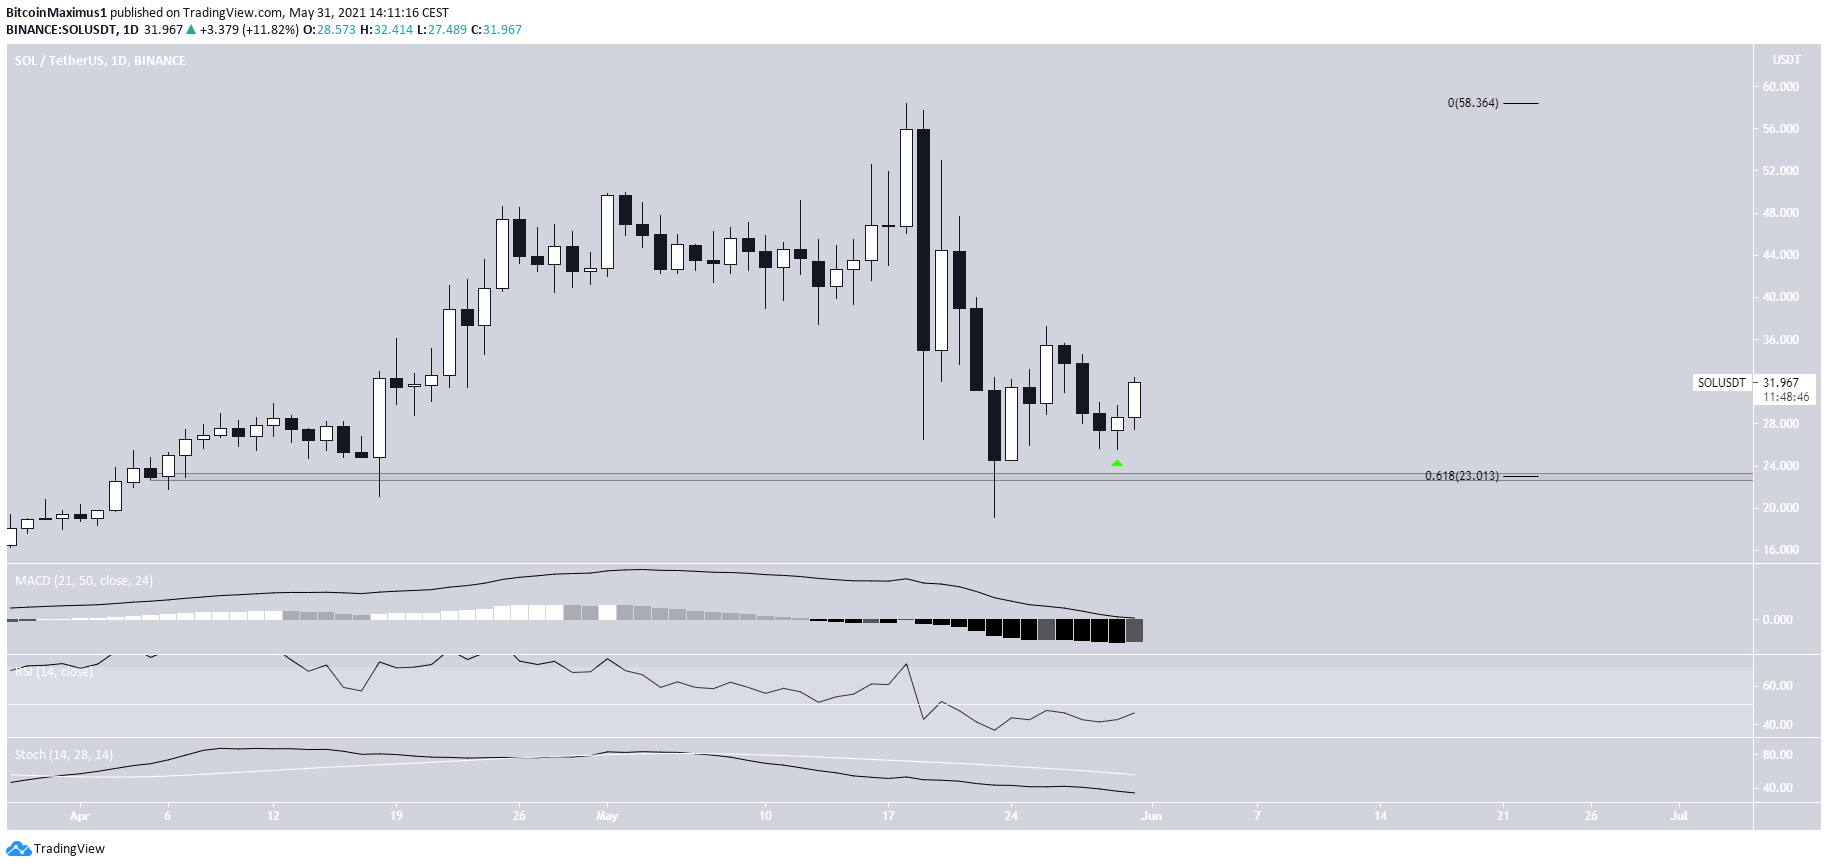
Short-term movement
Cryptocurrency trader @TradingTank tweeted a SOL chart, stating that it has a good-looking setup, due to the reclaim of a horizontal support area.
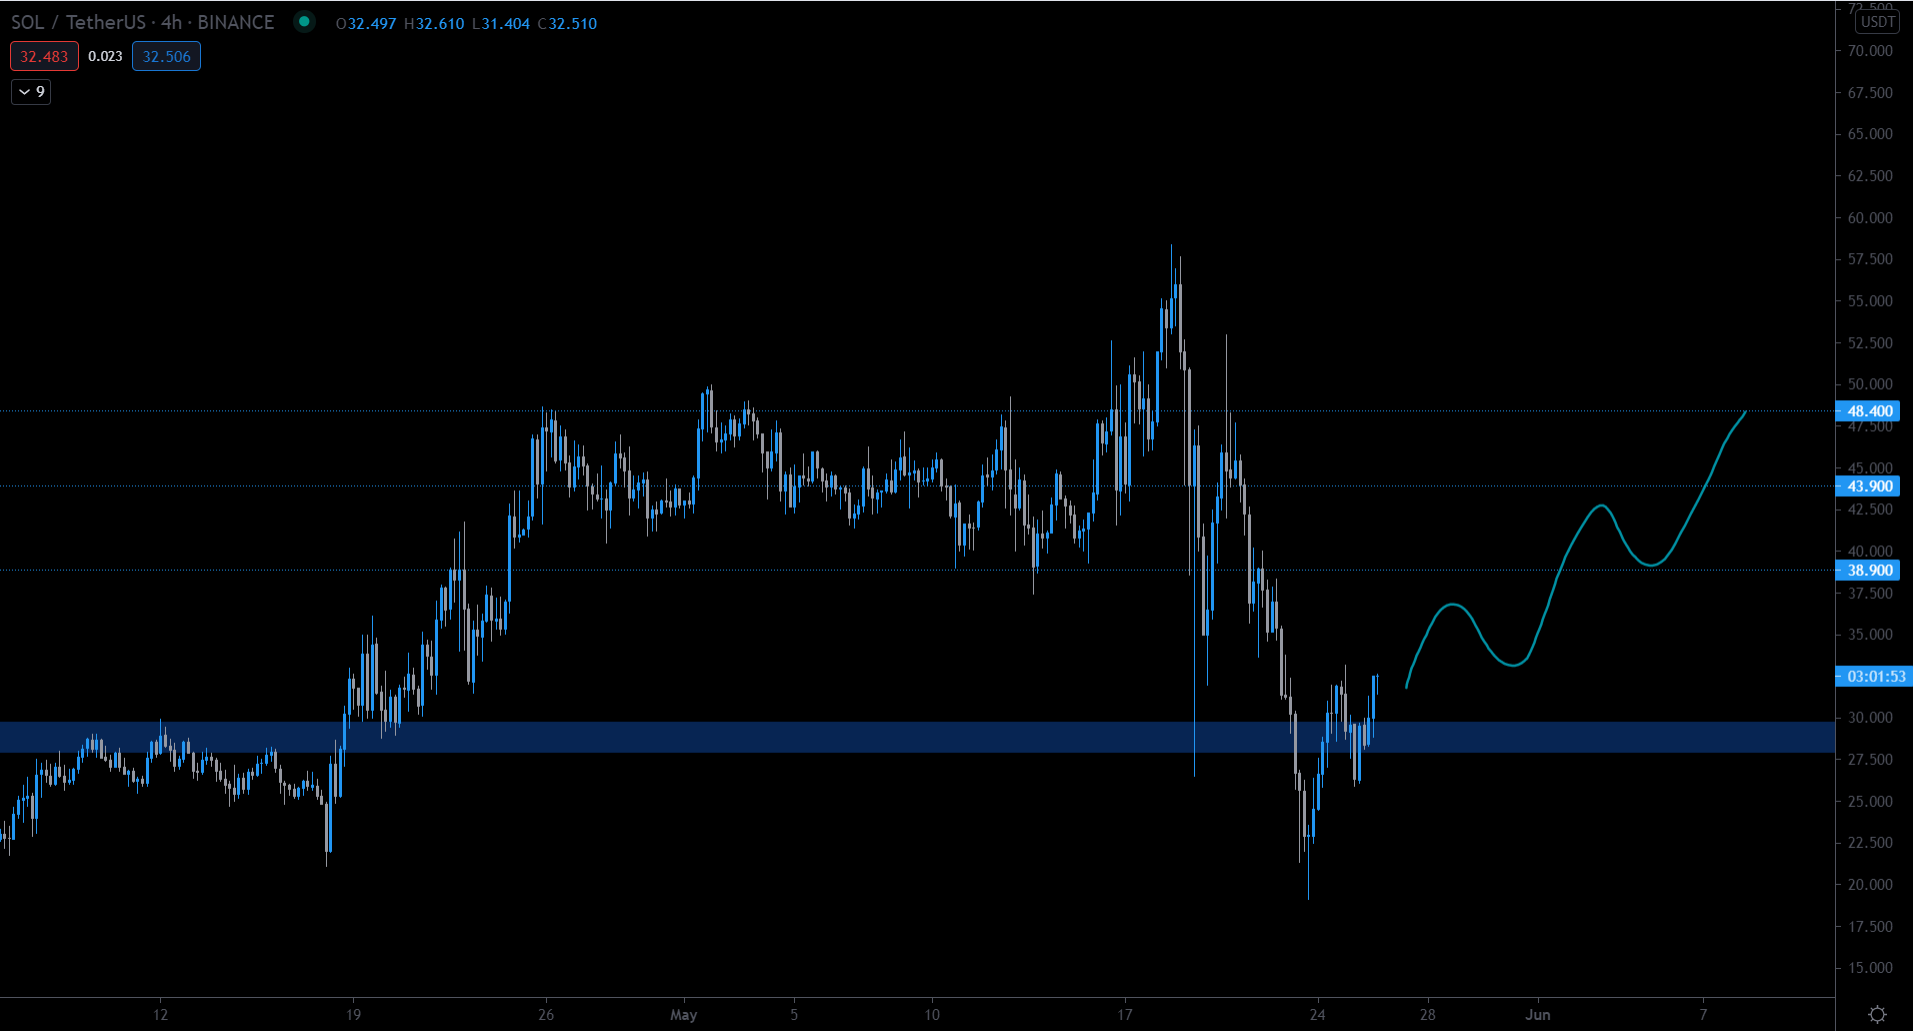
On top of this, SOL has also broken out from a descending resistance line, further implying that the trend is turning bullish. In addition, the RSI has broken out above 50 (green icon).
The main resistance area is found at $36.50. If successful in moving above it, the token could increase all the way to $49 and potentially move towards a new all-time high.
Firstly, the reclaim of the $36.50 area is crucial, since besides creating a bullish structure, it would also turn daily indicators bullish.
Sponsored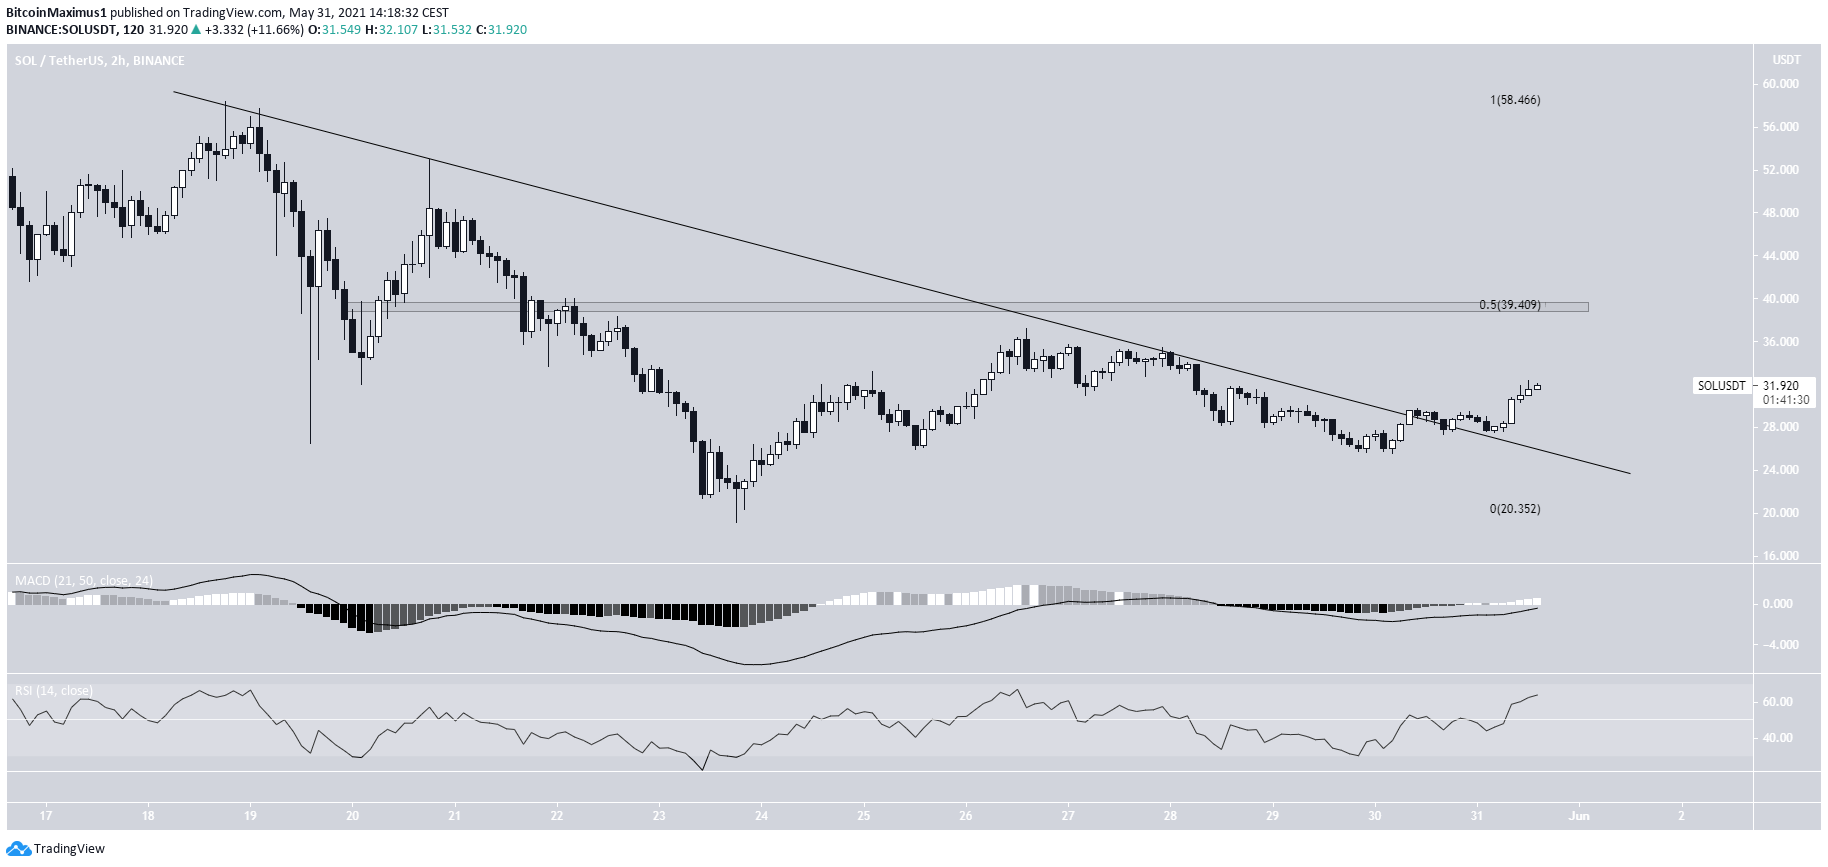
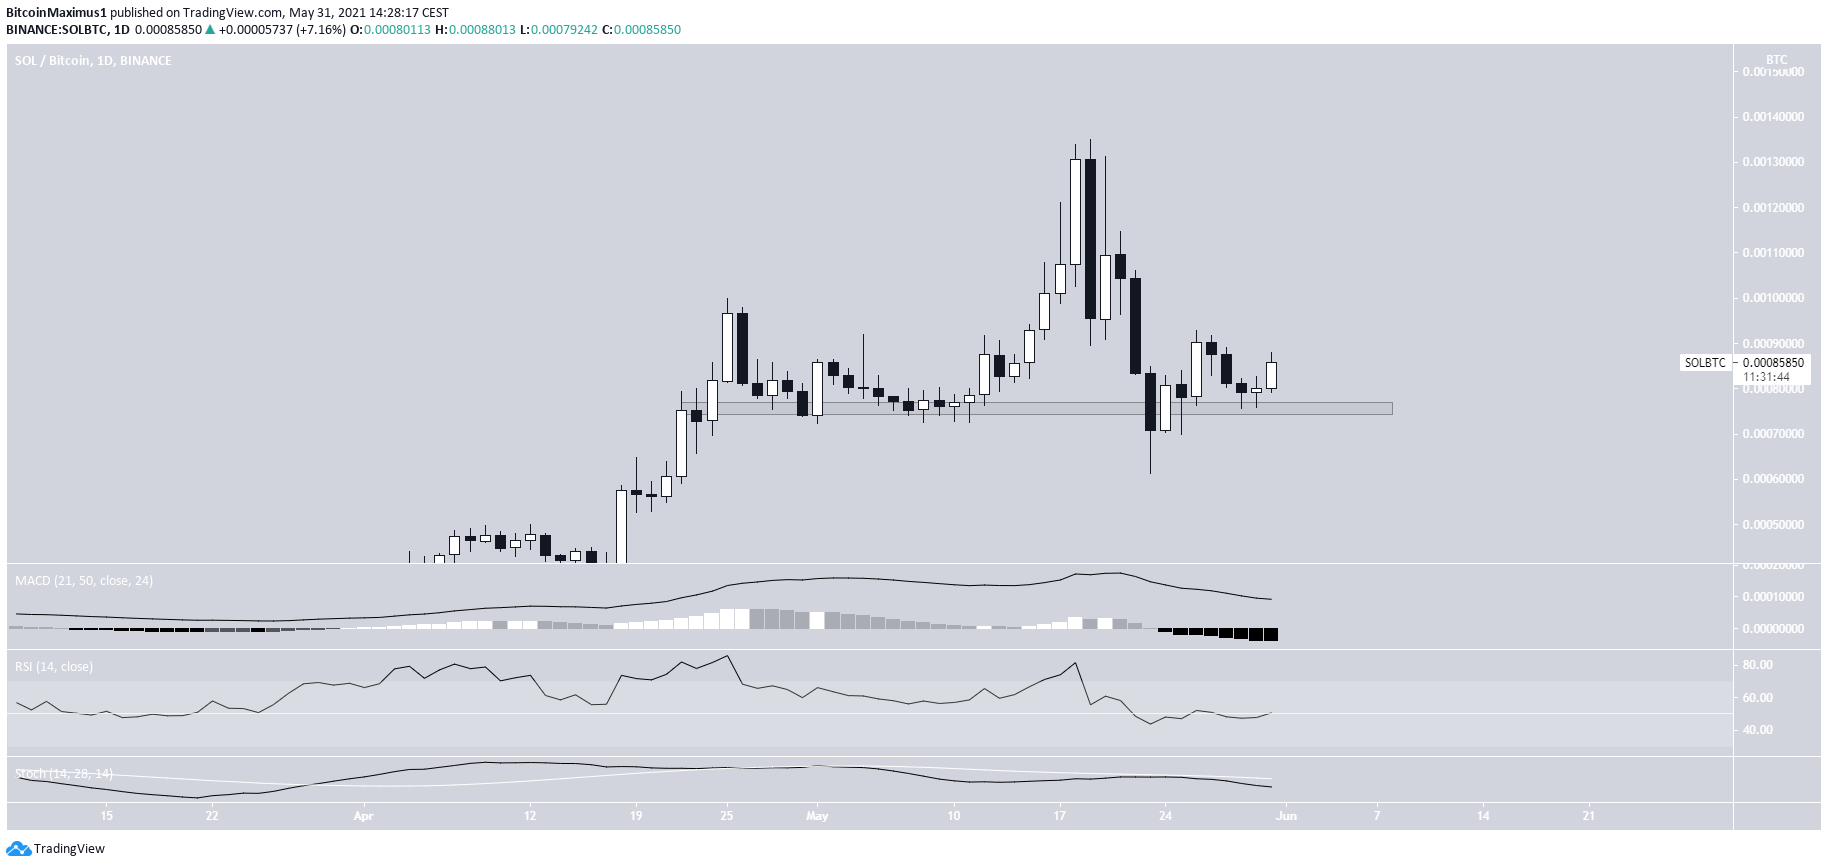
SOL/BTC
The SOL/BTC chart is relatively similar to its bullish counterpart. It bounce at the 76,000 satoshi support area, after deviation below it.
Similarly, technical indicators are neutral and the token has created a higher low. Therefore, the potential to create a bullish structure is there. However, the reversal is not confirmed yet.
For BeInCrypto’s latest bitcoin (BTC) analysis, click here.
