
SHIBA INU (SHIB) has regained its footing after a breakdown from a symmetrical triangle. On the contrary, Dogecoin (DOGE) has yet to move above its resistance line.
SHIB
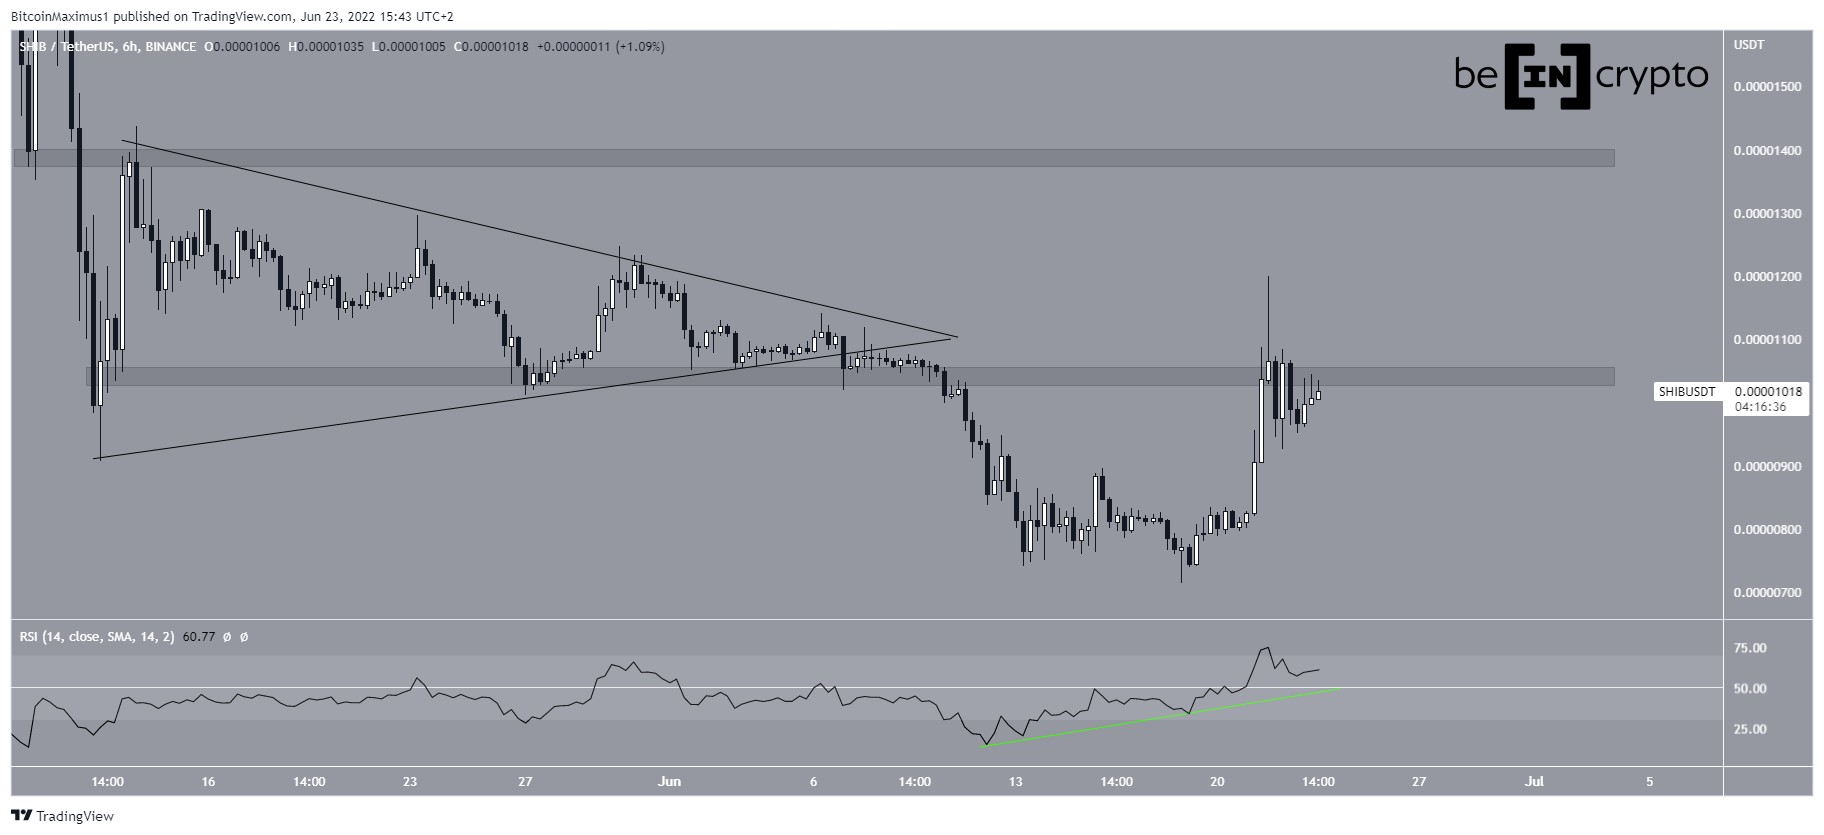
On June 6, SHIB broke down from a symmetrical triangle that had previously been in place since May 15. The symmetrical triangle is considered a neutral pattern, meaning that both a breakout and breakdown can occur.
The breakdown also caused a decrease below the $0.000011 area, which had been providing support throughout this same period. Afterward, SHIB resumed its descent until reached a low of $0.000071 on June 18.
SponsoredThe price has been increasing since, in an upward movement that was preceded by a considerable bullish divergence in the RSI (green line). Additionally, the RSI has now moved above 50, in what is also considered a sign of a bullish trend.
As a result of these readings and the price action, a reclaim of the $0.000011 area and a potential increase towards $0.000014 seem likely.
While the price already did increase above the $0.000011 resistance area, it failed to sustain the increase and created a long upper wick.
DOGE
DOGE has been decreasing underneath a descending resistance line since May 12. Unlike SHIB, it has yet to move above this line, despite the ongoing bounce.
Similar to SHIB, the six-hour RSI has generated a significant bullish divergence that led to a move above 50.
However, the price is still trading below the $0.072 area, which now coincides with the aforementioned descending resistance line.
As a result of this confluence of resistance levels, the price action for DOGE is more bearish than that of SHIB. A breakout from both the $0.072 resistance area and descending resistance line would be required for the trend to be considered bullish.

For Be[in]Crypto’s latest bitcoin (BTC) analysis, click here
