
On May 30, 2019, the Ripple price (XRP) reached a high of $0.47. A rapid decrease ensued and the price reached a low of $0.40 the same day. A gradual increase followed. On June 3, the price reached a high of $0.46.
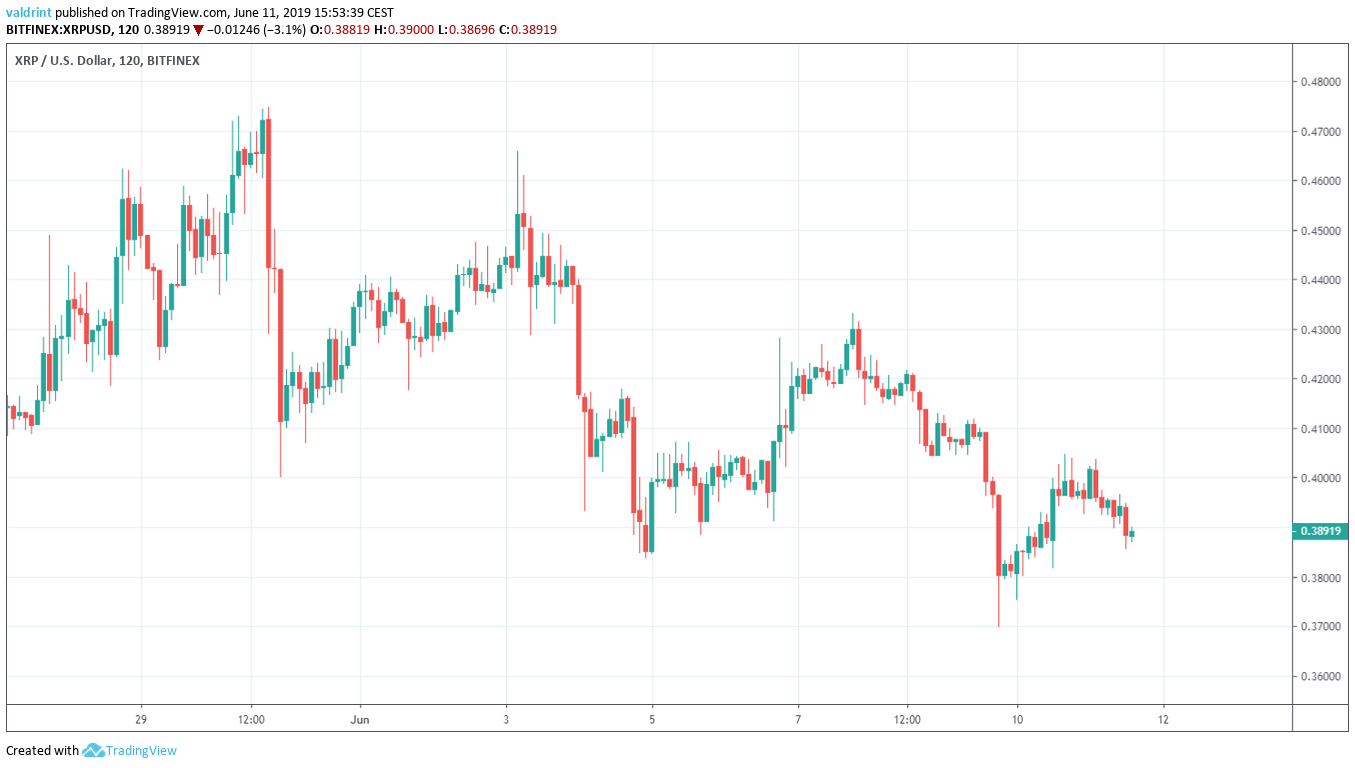
The price has been decreasing since, reaching lows below $0.38 on June 9.
SponsoredWhere will the Ripple price (XRP) go next? Keep reading below and find out. For our previous analysis, click here.
Ripple Price (XRP): Trends and Highlights for June 11
- XRP/USD reached a high on May 30.
- It is trading inside a descending channel.
- There is bearish divergence developing in the RSI.
- The 10- and 20-day moving averages have made a bearish cross.
- The 100- and 200-day moving averages have made a bullish cross.
- There is resistance near $0.43.
- There is support near $0.34.
Previous Movement
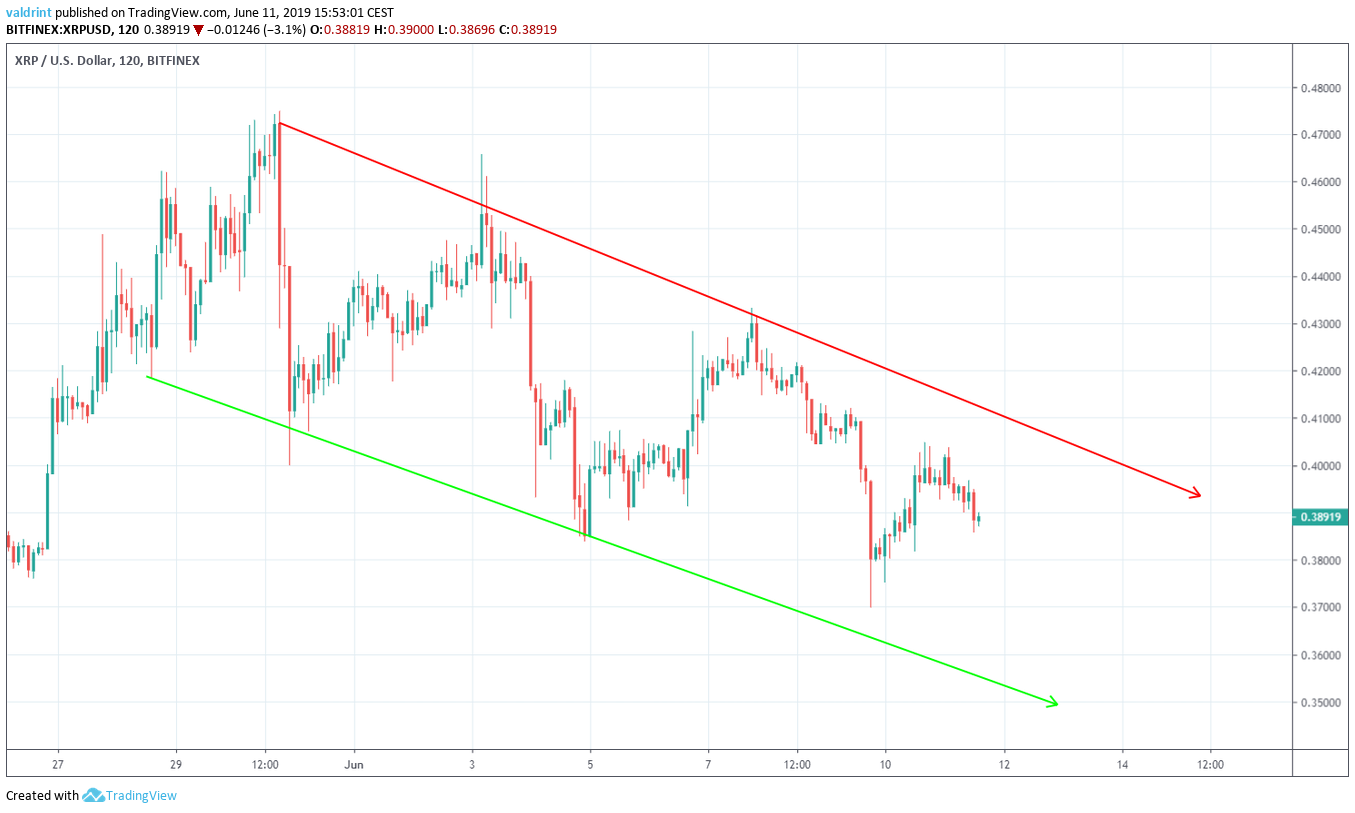
At the time of writing, the Ripple price (XRP) was trading in the middle of the channel. It is worth noting that since touching the resistance line on June 7, the price fluctuations have gotten significantly smaller and the price has not touched the resistance nor support lines again.
This could be a sign that the price is trying to create a different trading pattern.
Ripple Price (XRP): Technical Indicators
Sponsored Sponsored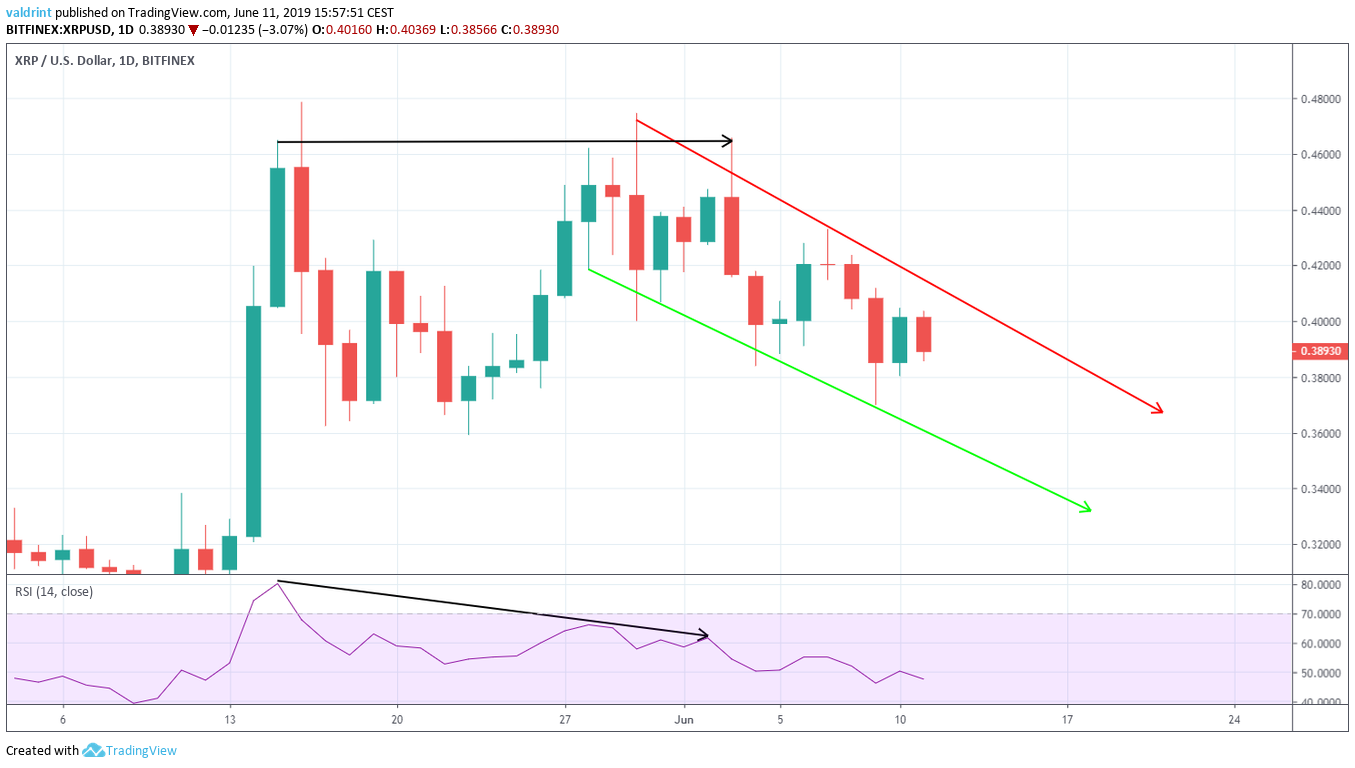
In the case of XRP, it preceded the decrease which created the descending channel.
Yesterday we stated that:
The 10-day MA is on the verge of crossing below the 20-day one. This is known as a bearish cross and often indicates that a downtrend has begun.
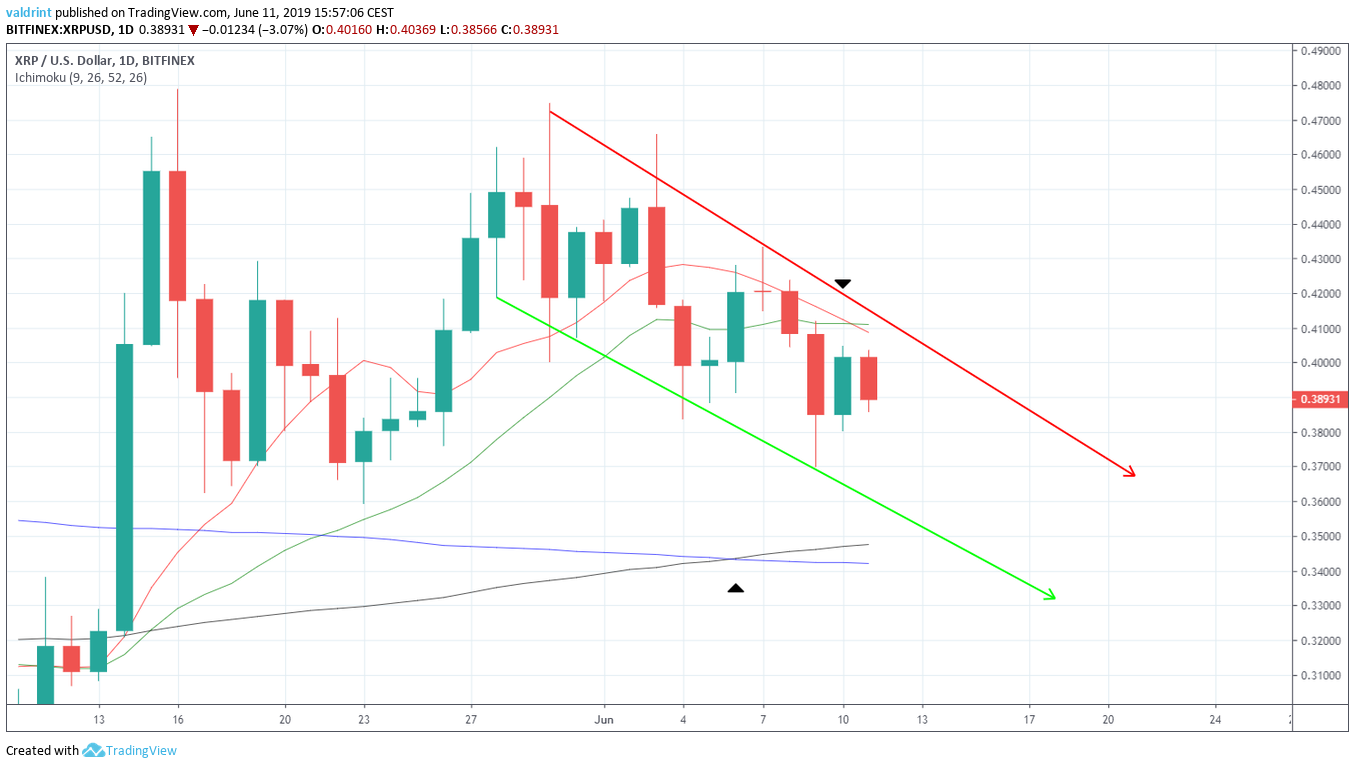
Today, a bearish cross occurred. At the time of writing, the Ripple price (XRP) was trading below both moving averages. The combination of these indicators supports further price decreases.
However, on June 6, the 100-day MA crossed above the 200-day one. This is an indication that an uptrend may have begun. However, this is a long-term indicator. Therefore, it is still likely that the price will continue to decrease in the short-term.
However, it should eventually find support and begin an upward move.
Reversal Areas
One support and one resistance area is traced for XRP below.
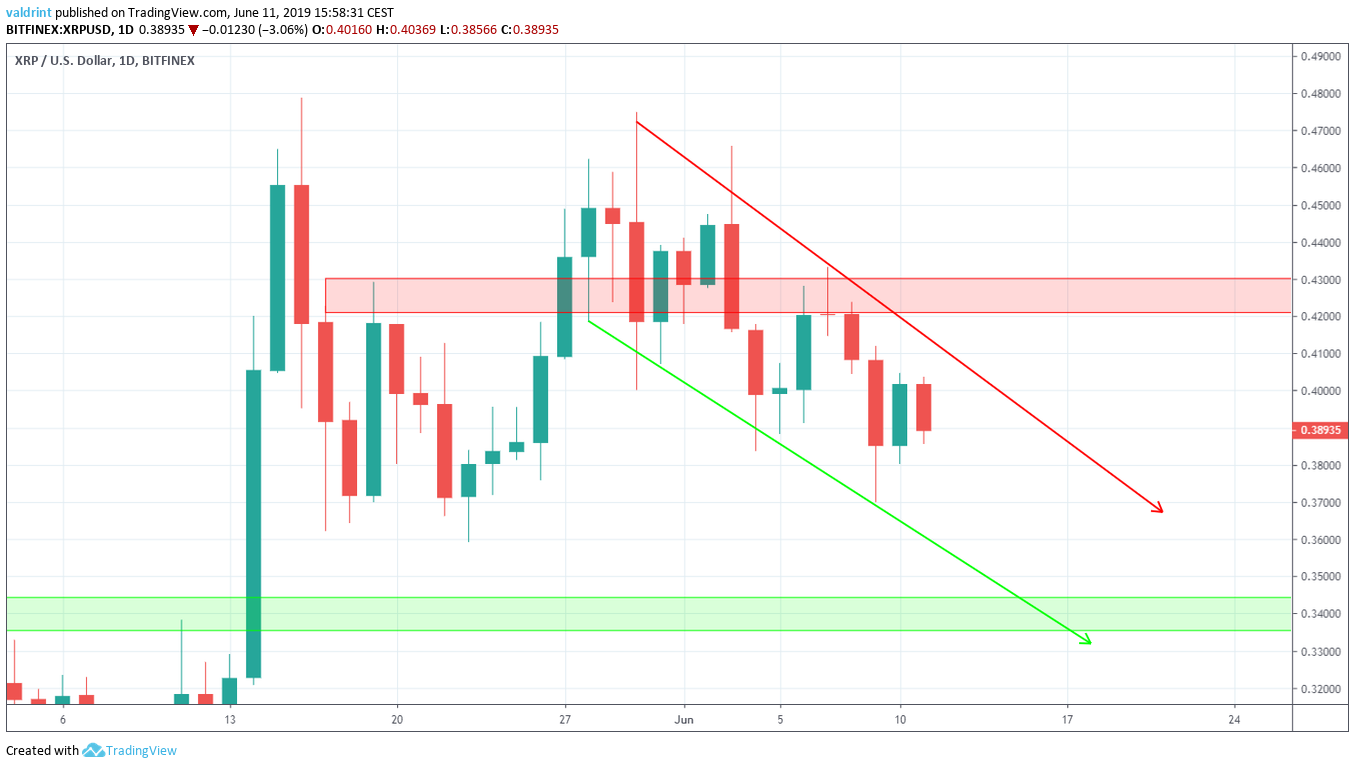
The closest support area is found near $0.34. If the Ripple price (XRP) continues to decrease at the rate predicted by the channel, it will reach this area around June 18. An analysis of technical indicators supports this possibility.
The closest resistance area is found near $0.43. If the price breaks out from the channel, it is likely to provide a reversal.
Sponsored SponsoredSummary
To conclude, the Ripple price (XRP) made a high on May 30 and is currently trading inside a descending channel. Short-term moving averages have made a bearish cross and are providing resistance to the price. Furthermore, there is bearish divergence developing in the RSI. The use of these indicators makes it likely that the XRP price will eventually reach the support area outlined above.
Do you think the Ripple price (XRP) will break down from the triangle? Let us know in the comments below.
Disclaimer: This article is not trading advice and should not be construed as such. Always consult a trained financial professional before investing in cryptocurrencies, as the market is particularly volatile.
