
After four unsuccessful attempts, the Monero (XMR) price finally broke out from a 665-day resistance line, indicating that the previous downward movement had ended.
Bullish signs in long- and short-term time frames suggest the XMR price will continue increasing toward the next resistance area.
Monero Price Finally Clears 665-Day Resistance
SponsoredThe technical analysis of XMR in the weekly time frame reveals a significant price increase. The upward movement began following a rebound from the $130 support level on June 10.
Two weeks later, the price broke out from a descending resistance line that had persisted for 665 days.
A breakout from such a long-standing pattern suggests completing the previous correction. However, it is important to note that while the XMR price closed above this line, it has yet to initiate a rally toward the next resistance at $260.
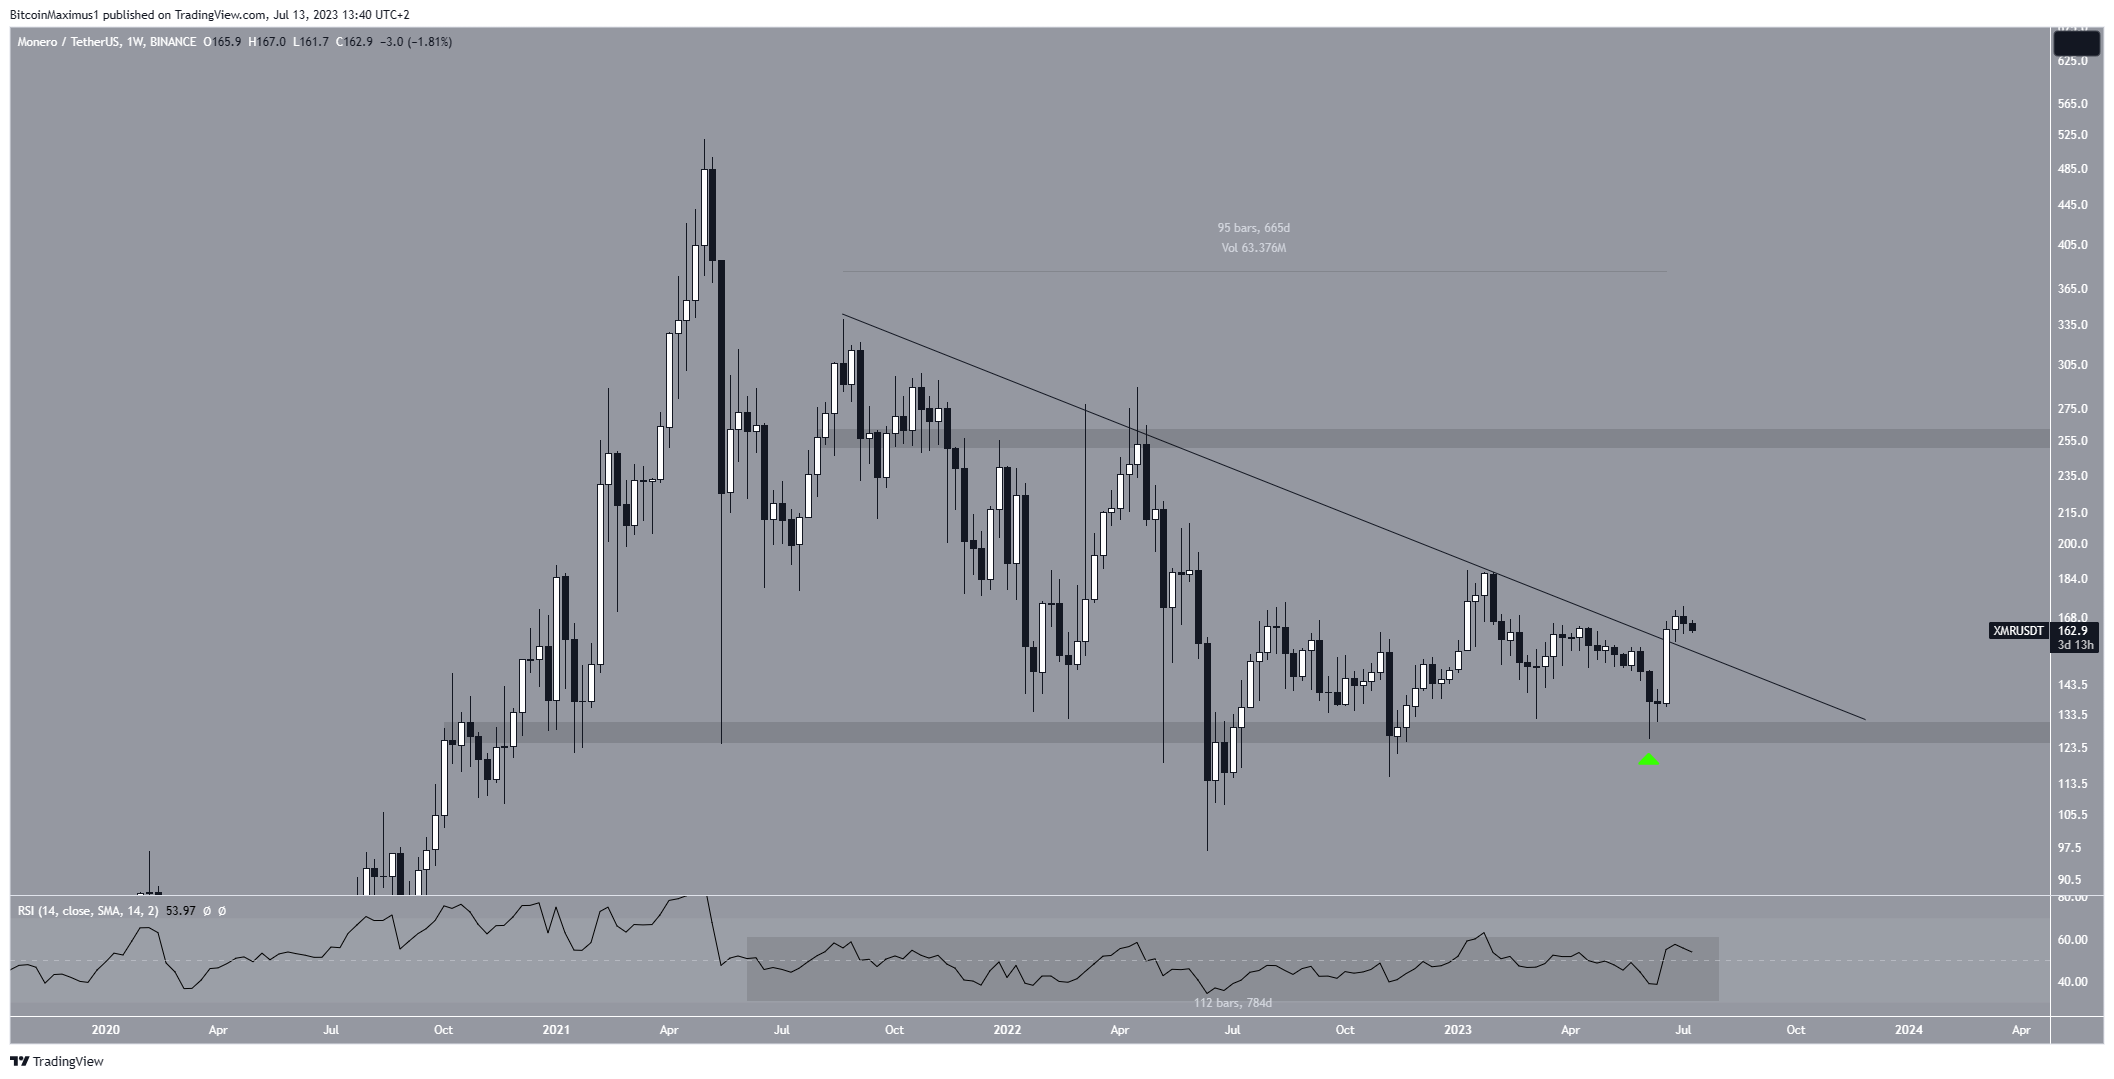
Additionally, despite the upward movement, the confirmation of the breakout is not supported by the weekly RSI. Traders commonly employ the RSI as a momentum indicator to gauge whether a market is overbought or oversold, aiding their decision-making on asset accumulation or selling.
When the RSI reading surpasses 50, and the trend is upward, the bulls maintain an advantage. Conversely, if the reading falls below 50, the opposite holds true.
Although the RSI currently sits slightly above 50, it has fluctuated above and below this threshold since mid-July 2021 (highlighted). This is a sign of an indeterminate trend.
Read More: How To Make Money in a Bear Market
SponsoredXMR Price Prediction: Wave Count Supports Increase to $200
Similarly to the weekly time frame readings, the daily ones lean bullish. There are several reasons for this.
Firstly, the price has broken out from a shorter-term descending resistance line and is trading above the $160 horizontal support area. The area had previously provided resistance and has now seemingly turned to support.
Secondly, the wave count suggests that the price completed an A-B-C correction (black) beginning in February. Then, it began a new five-wave increase in June (white). If the count is correct, the price will complete wave four soon and begin the fifth and final wave towards $200.
SponsoredHowever, the RSI does not confirm the bullish count. While the indicator is above 50, it decreases, providing some conflicting signs.
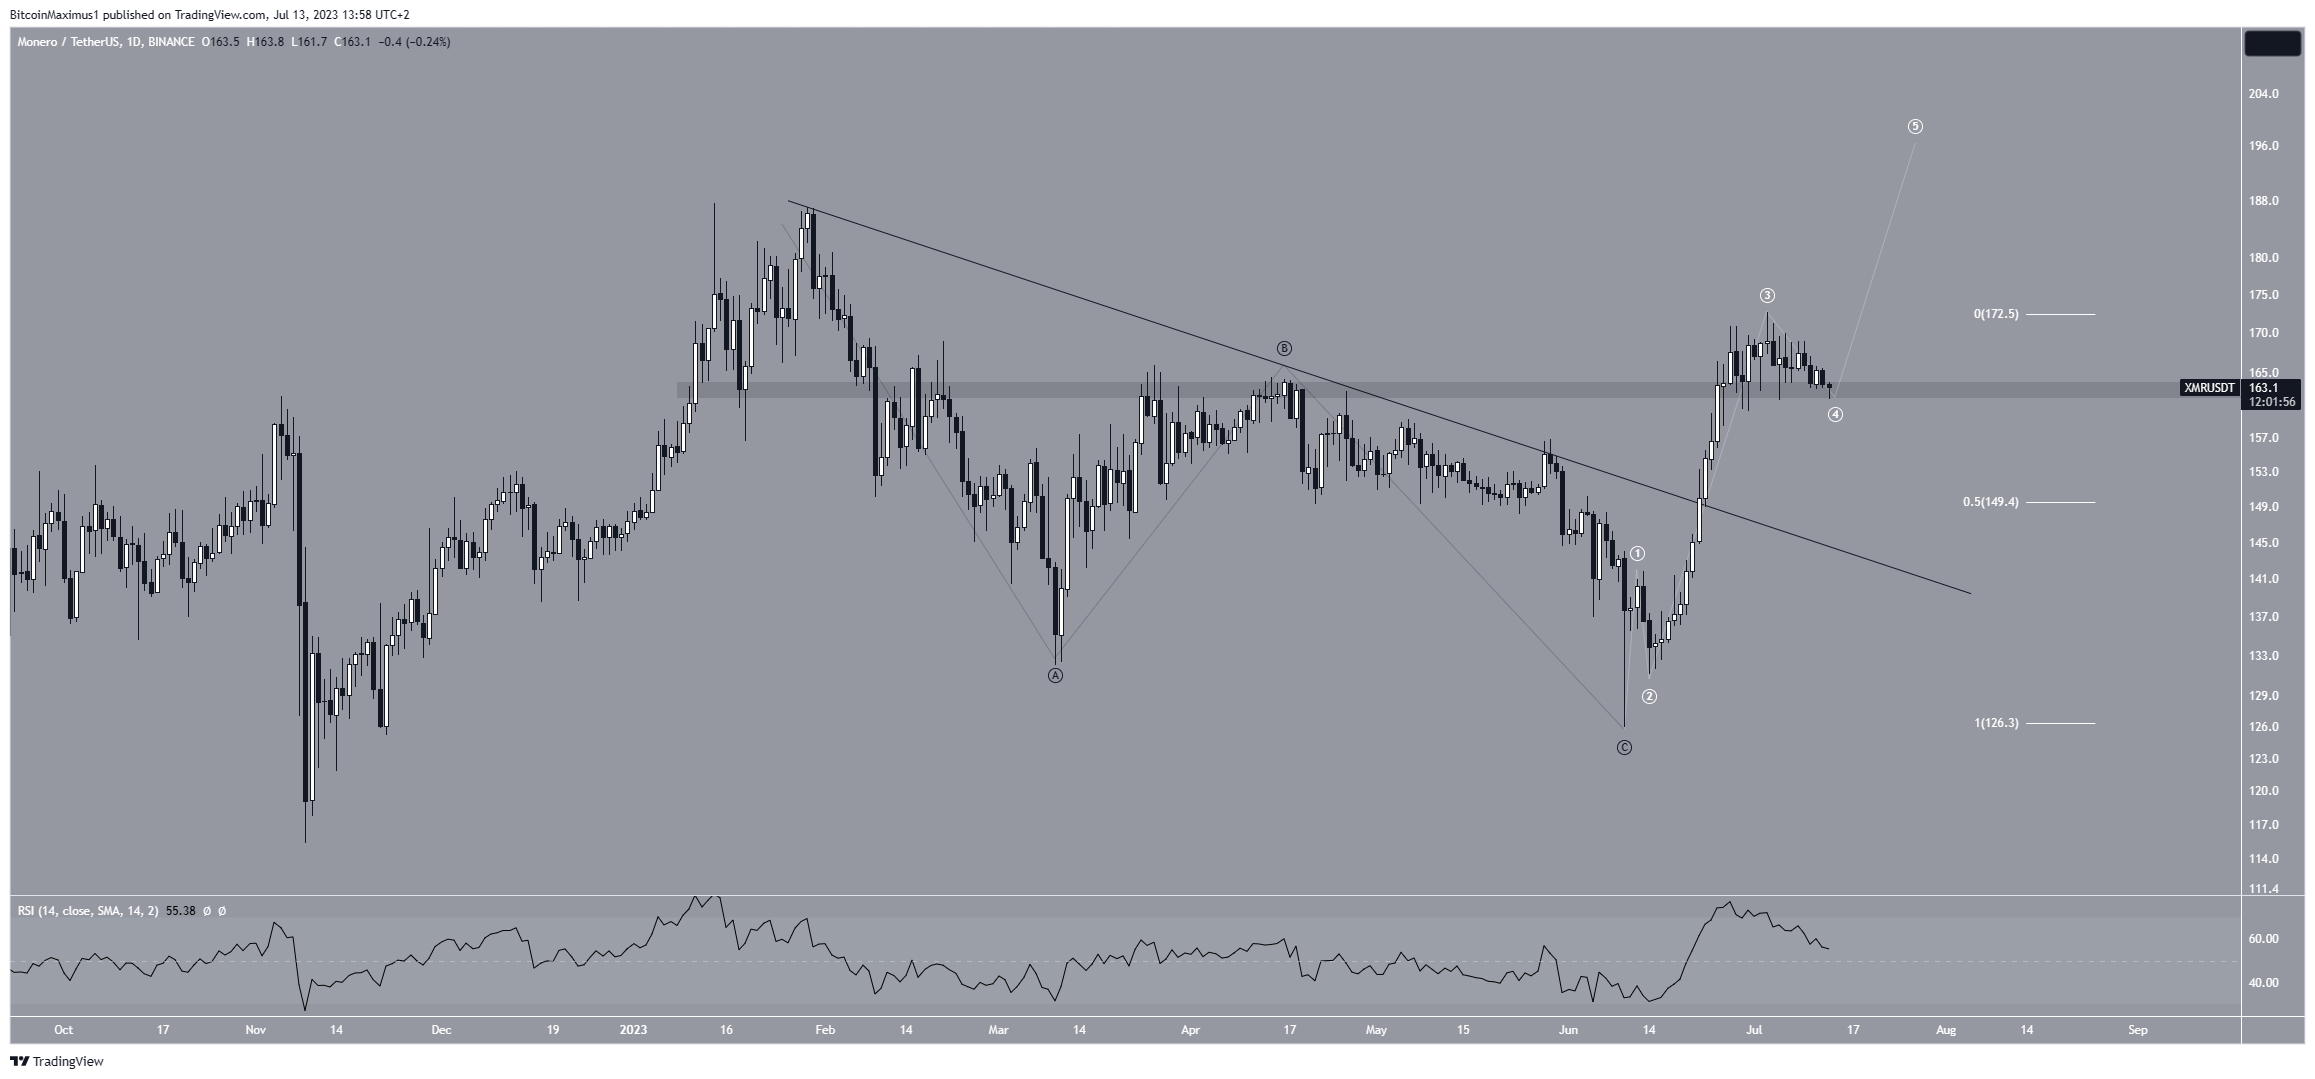
Despite this bullish XMR price prediction, a daily close below the $160 area will mean that the price will retrace further, possibly reaching the $150 support created by the 0.5 Fibonacci retracement level.
Read More: 9 Best Crypto Demo Accounts For Trading
For BeInCrypto’s latest crypto market analysis, click here.
