
The MATIC price is rapidly approaching the end of the symmetrical triangle it has been trading in since December 11. Both a breakout and a breakdown remain possible. The use of a stop loss is highly recommended.
MATIC Highlights
- The MATIC price is following an ascending support line
- It has found support above the 200-day moving average (MA).
- The price is trading inside a short-term descending channel.
- There is resistance at 260 satoshis.
Full-time trader @CryptoMichNL outlined the MATIC price movement, stating that the current price level makes him optimistic about the prospects of an upward move since it has been holding above the ascending support line without breaking down.
Looks ready to me for a good upwards move as it's holding the trendline on the $BTC pair too.
Aiming to see $0.015-$0.016 hold as support and we can see upwards momentum towards $0.02 or even $0.025.https://t.co/mdjxsWvbor
— Michaël van de Poppe (@CryptoMichNL) January 27, 2020
Will the MATIC price increase? If so, where will it go? Continue reading below in order to find out.
Ascending Support
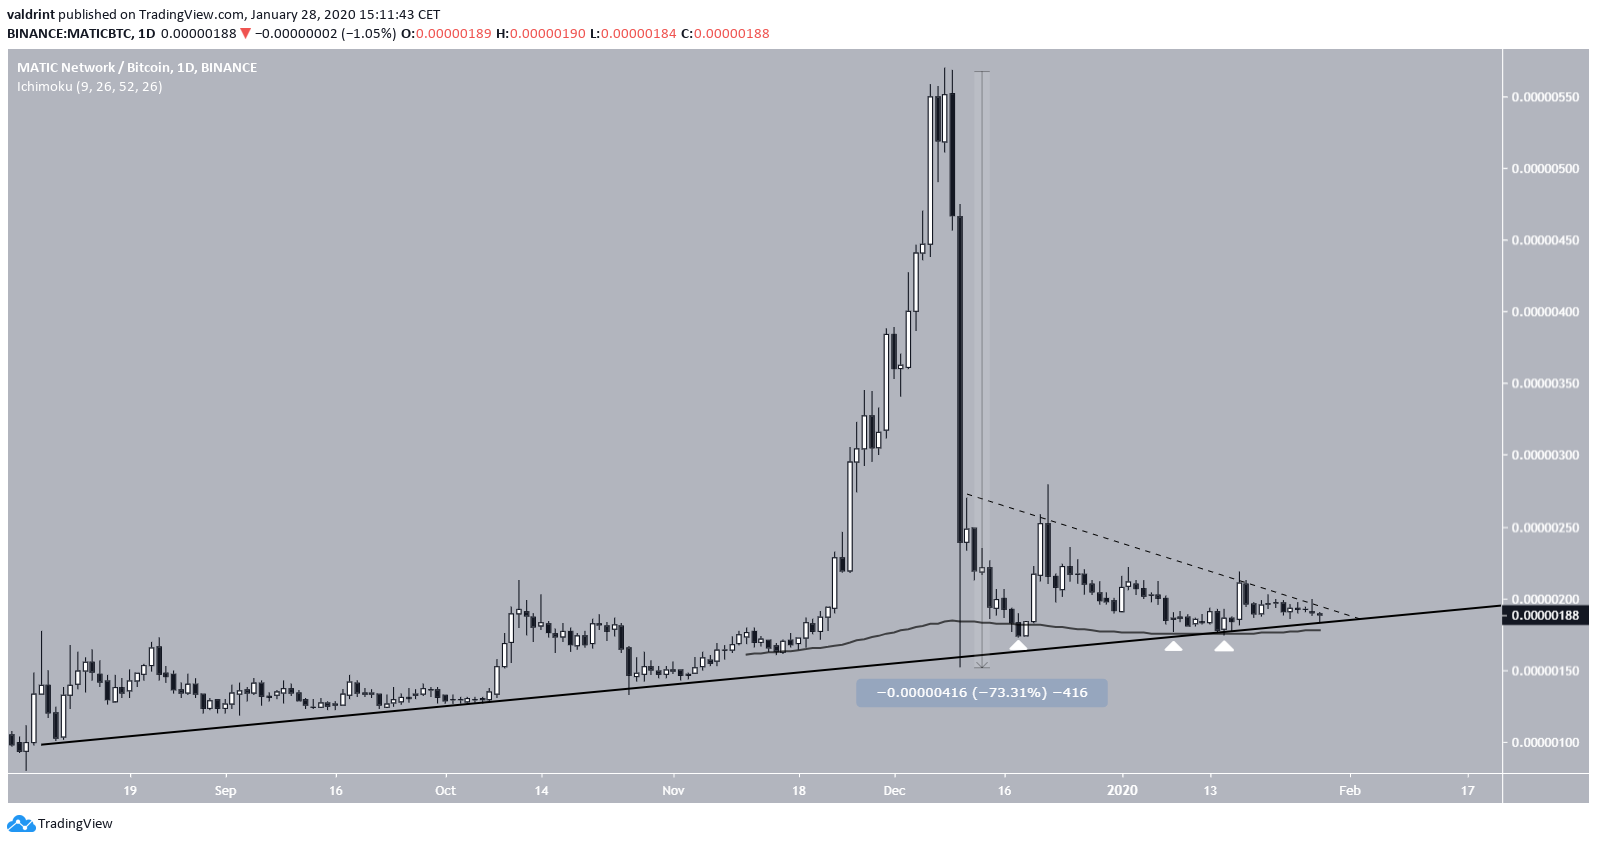
The MATIC price has been following an ascending support line since August 9. Even after the 70% increase that transpired in only two days, the price held strong above this ascending trendline.
SponsoredIn addition, the price is possibly following a descending resistance line since December 11. Combined, they create a symmetrical triangle. The price is quickly approaching the end of the triangle. Therefore, we would expect to see a significant movement in one direction very soon.
In addition, the price has seemingly found support above the 200-day MA, reducing the possibility that the price will break down.
Descending Channel
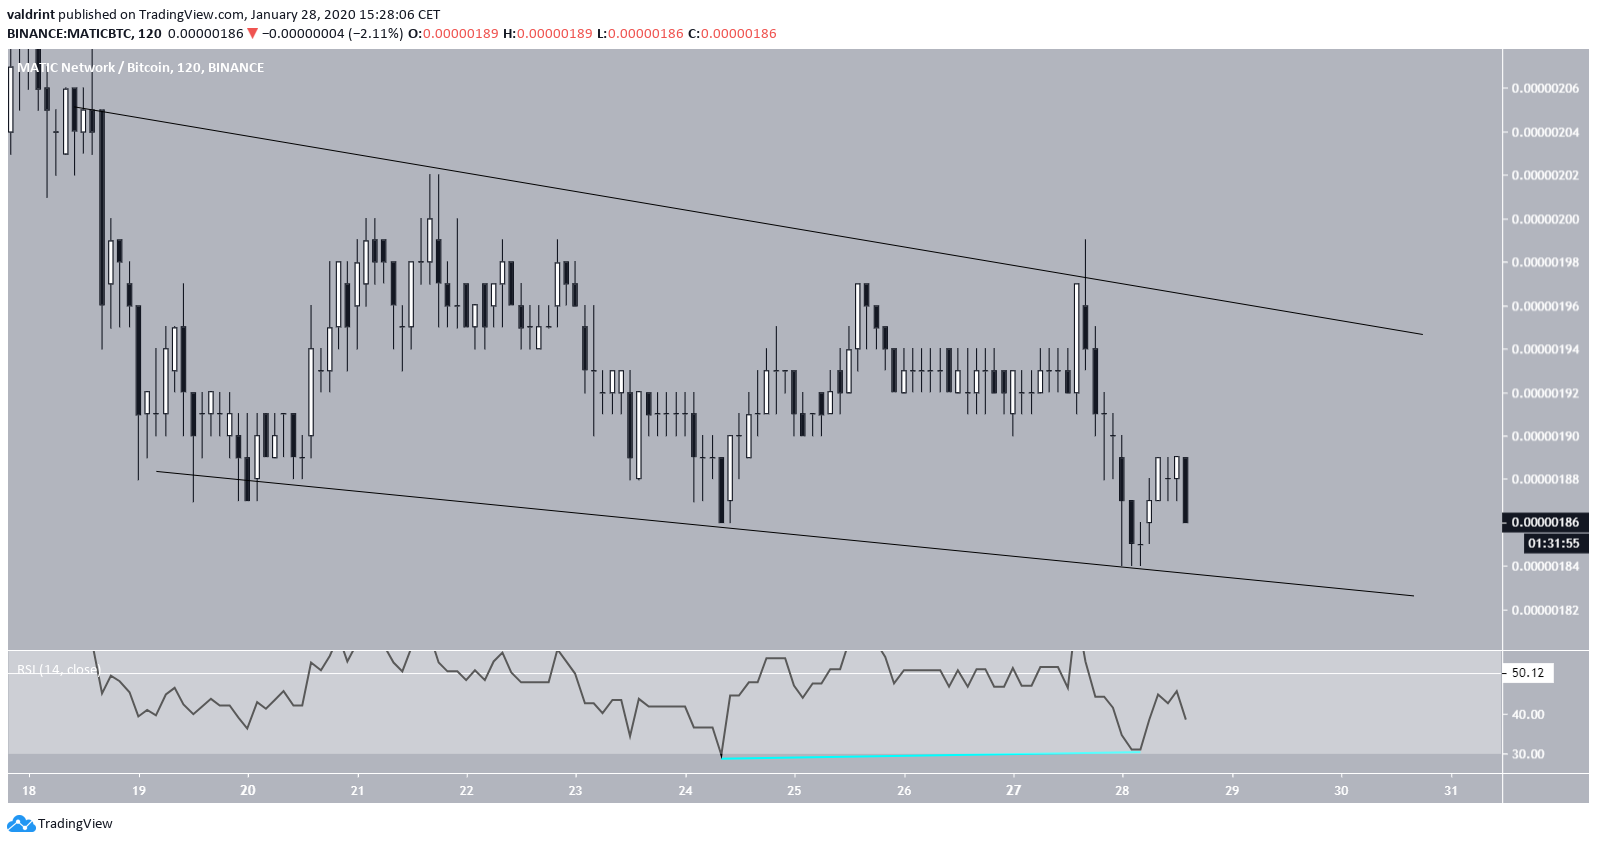
SponsoredIn the short-term, the MATIC price is trading inside a descending channel. The RSI shows consolidation since it has been moving freely above and below the 50-line.
While there is some bullish divergence, it is quite small and not significant enough to predict a breakout.
Going back to the previous ascending support line, while the 200-day MA is offering support, we are not certain that the price will not break down.
MATIC Future Movement
SponsoredDue to the lack of resolution from technical indicators and price movement, we are not certain of the direction of the next price movement.
Therefore, the use of a stop loss below 170 satoshis is highly recommended, since we do not believe the price will decrease below this area then reverse. So, the stop loss would prevent from additional losses while allowing for profits in case the price breakouts.
SponsoredIf there is a breakout, the closest resistance area is found at 260 satoshis.
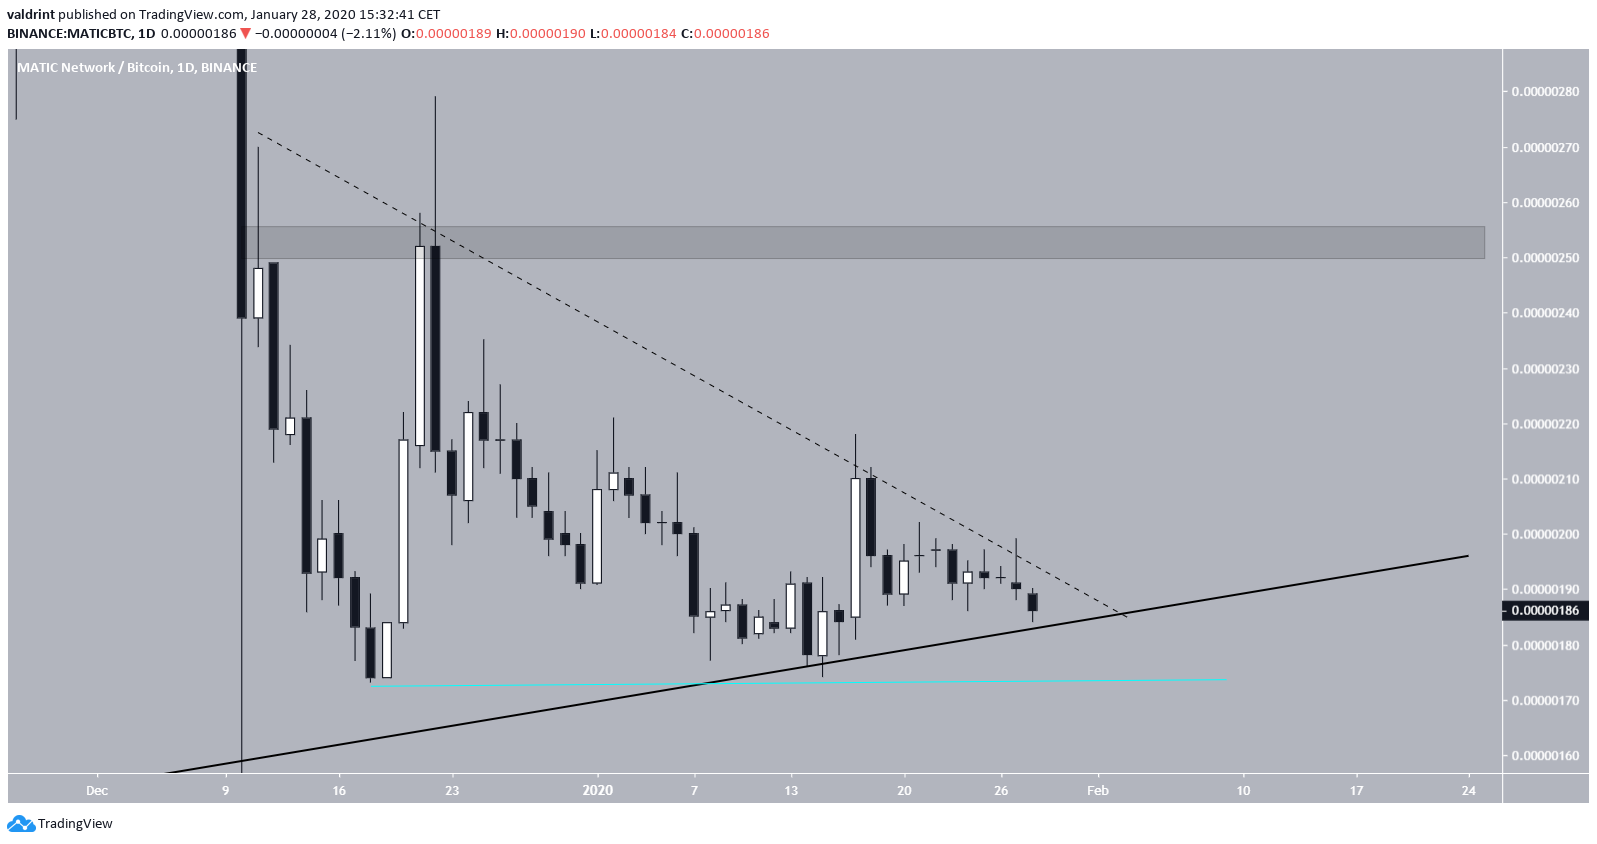
To conclude, the MATIC price is approaching the end of the symmetrical triangle. A breakdown below this pattern would indicate that the long-term ascending support line is broken and the price will head to new lows. Therefore, the use of a stop loss to protect from losses if this scenario transpires is recommended. In case the price breaks out, the closest resistance area is found at 260 satoshis.
