
The Decentraland (MANA) price is currently getting ready to initiate another upward move.
However, until the price clears the major resistance area at 950 satoshis, we cannot state with confidence that the trend is bullish.
Long-Term Resistance
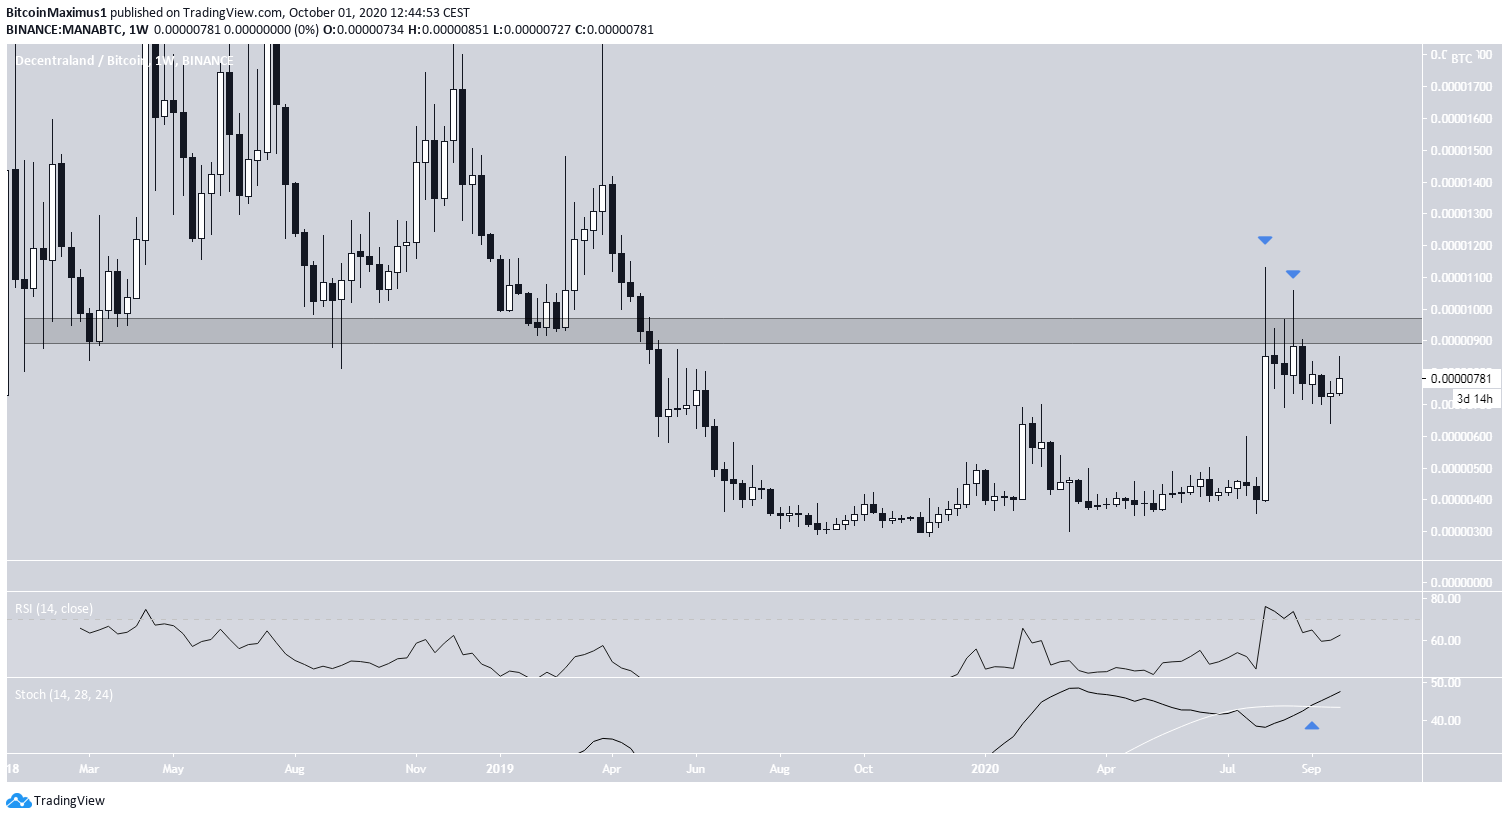
SponsoredThe MANA price initiated a rapid upward movement at the beginning of August, reaching a high of 1131 satoshis. However, the higher prices could not be sustained, resulting in several long upper wicks. The MANA price has been gradually declining since.
Technical indicators are bullish. The Stochastic Oscillator has made a bullish cross, and the RSI is neither overbought nor has it formed any bearish divergence.
However, until the price successfully reclaims the 950 satoshi area, the trend remains neutral.
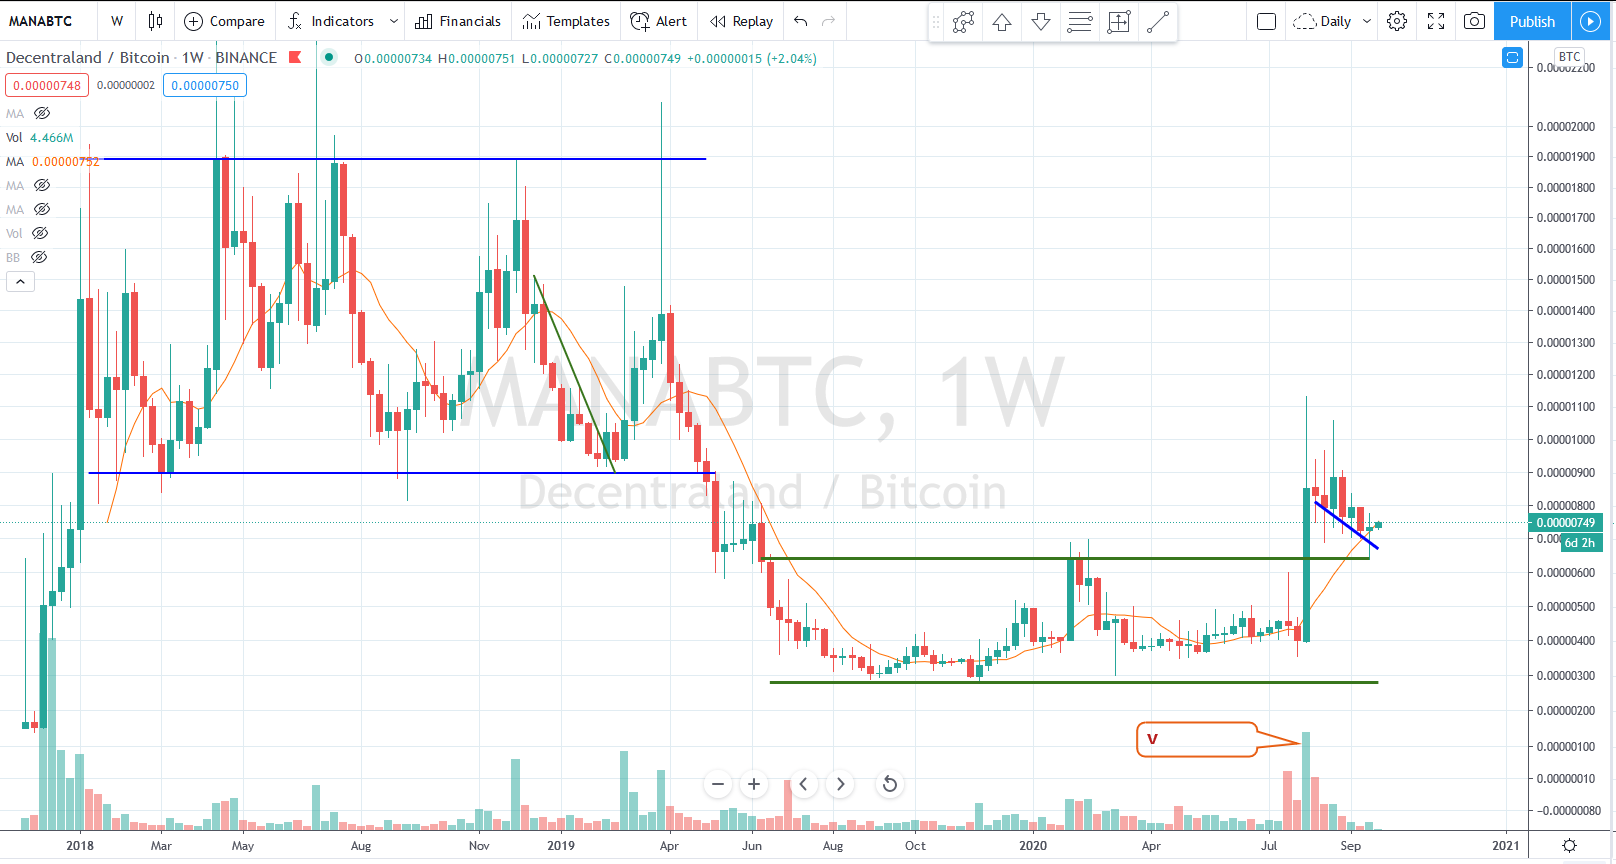
Well-known trader @BobLoukas outlined a MANA chart, which shows that the price has broken out from its previous range on high volume. It could soon resume its upward momentum. However, as outlined above, the potential for rallies remains limited as long as the price is trading below 950 satoshis.
End of the Retracement
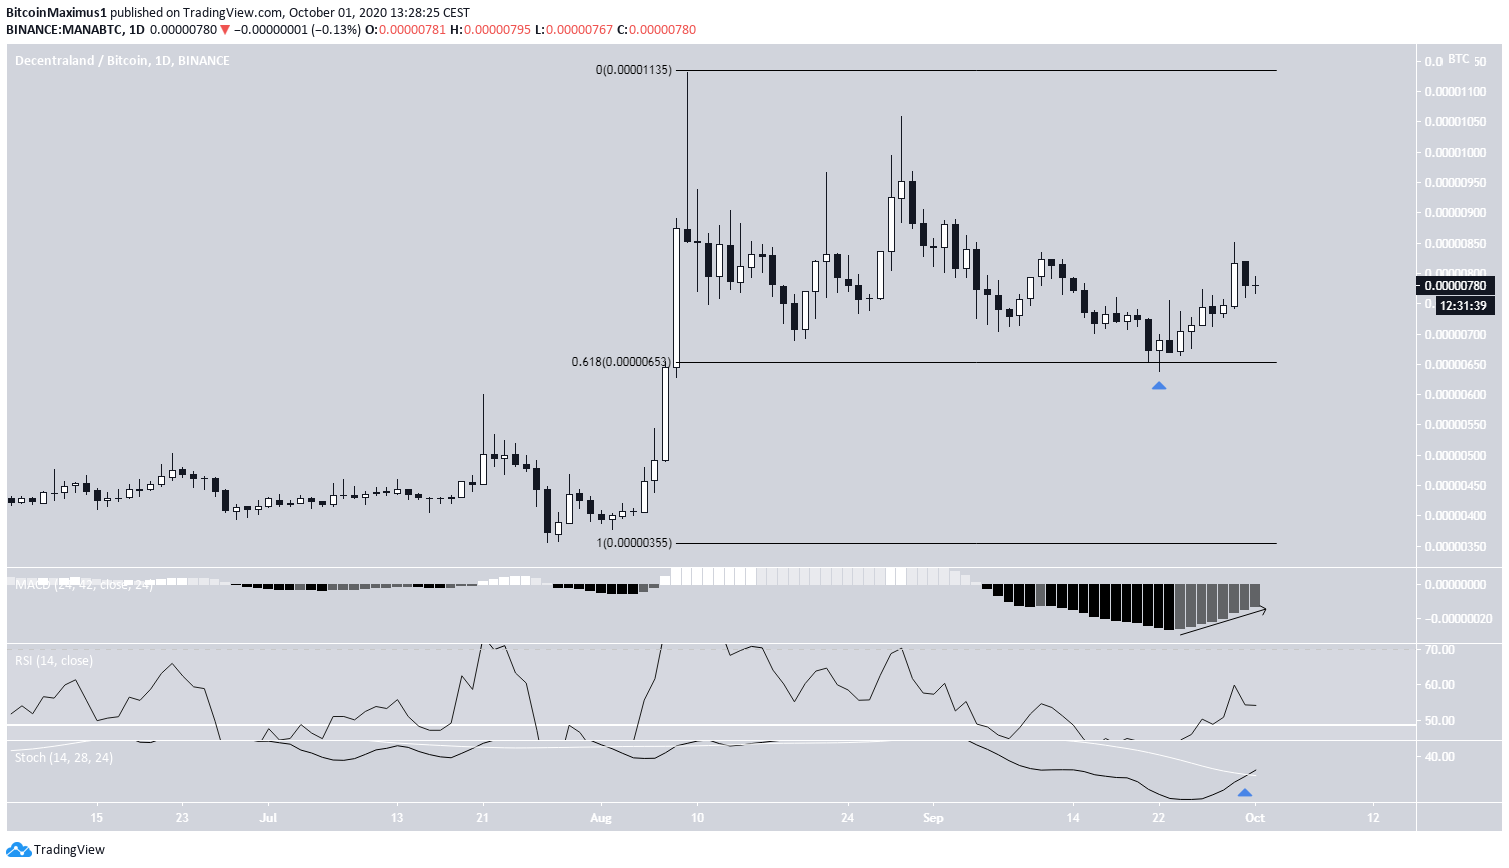
The daily chart shows that it’s possible the price has completed a retracement, with a low reached right at the 0.618 Fib level of the upward move at 639 satoshis on Sept 22.
Technical indicators on the daily time-frame are bullish. All three oscillators: MACD, RSI, and Stochastic are increasing, the latter having just made a bullish cross.
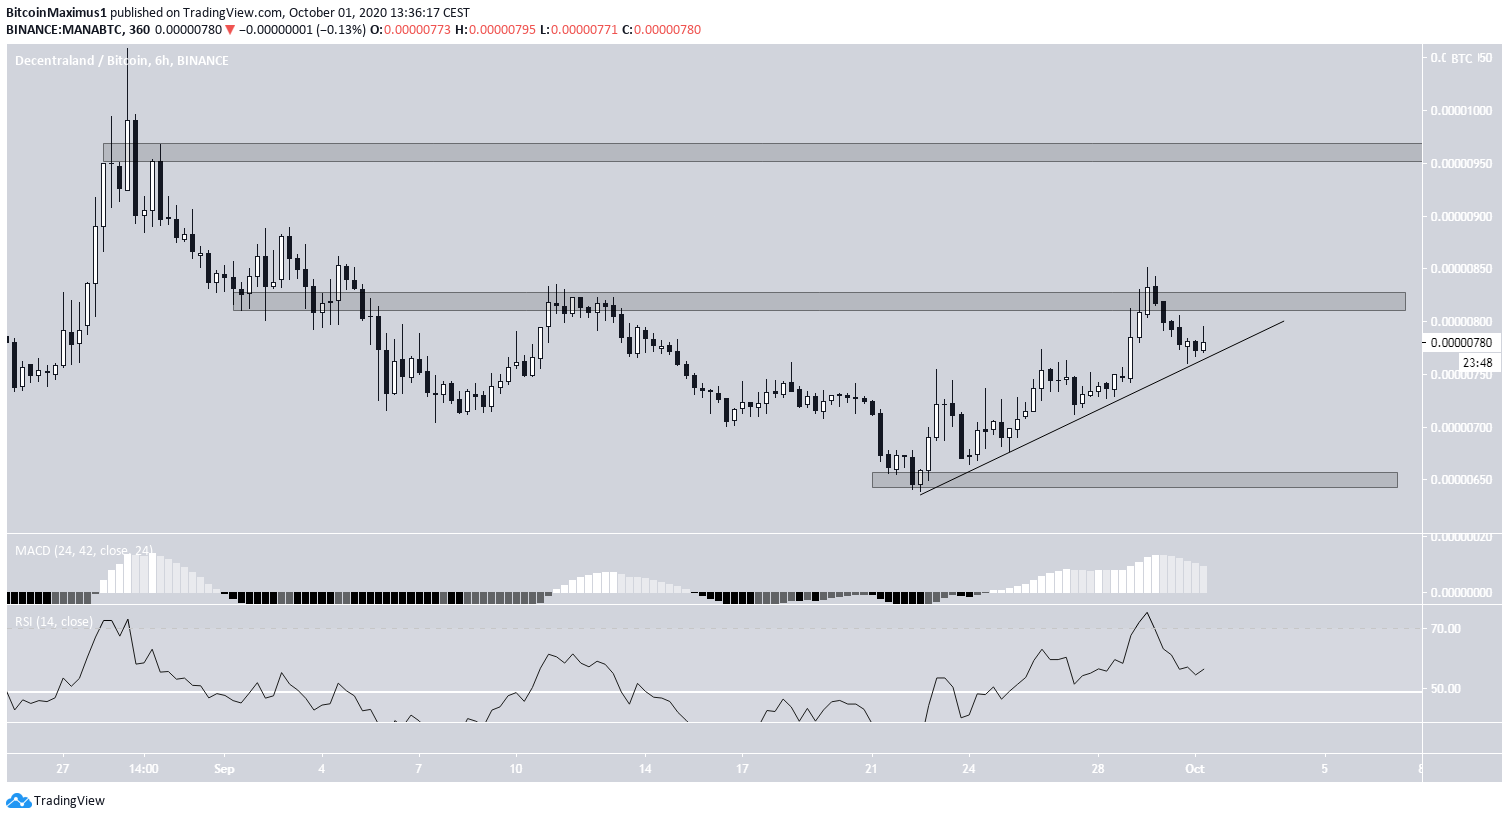
The shorter-term 6-hour chart shows that the price has deviated above the resistance area at 820 satoshis before falling back below it. The next closest resistance and support levels are found at 960 and 650 satoshis, respectively.
SponsoredIn addition, we can see that the price is following an ascending support line. A continued increase alongside this line would take the price to 960 satoshis, while a breakdown from support would take it back to 650 satoshis.
Indicators do not show any weakness in the trend, so whether the price breaks down from here or breaks out above the resistance area will likely determine the next direction.
A sustained move above 960 satoshis would be extremely bullish for the long-term trend.
Wave Count
SponsoredThe MANA/USD chart shows a possible A-B-C correction completed with a low on Sept 22. Waves A:C have a 1:1 ratio.
If so, the price has begun an upward move, which will likely take it towards new yearly highs.
Sponsored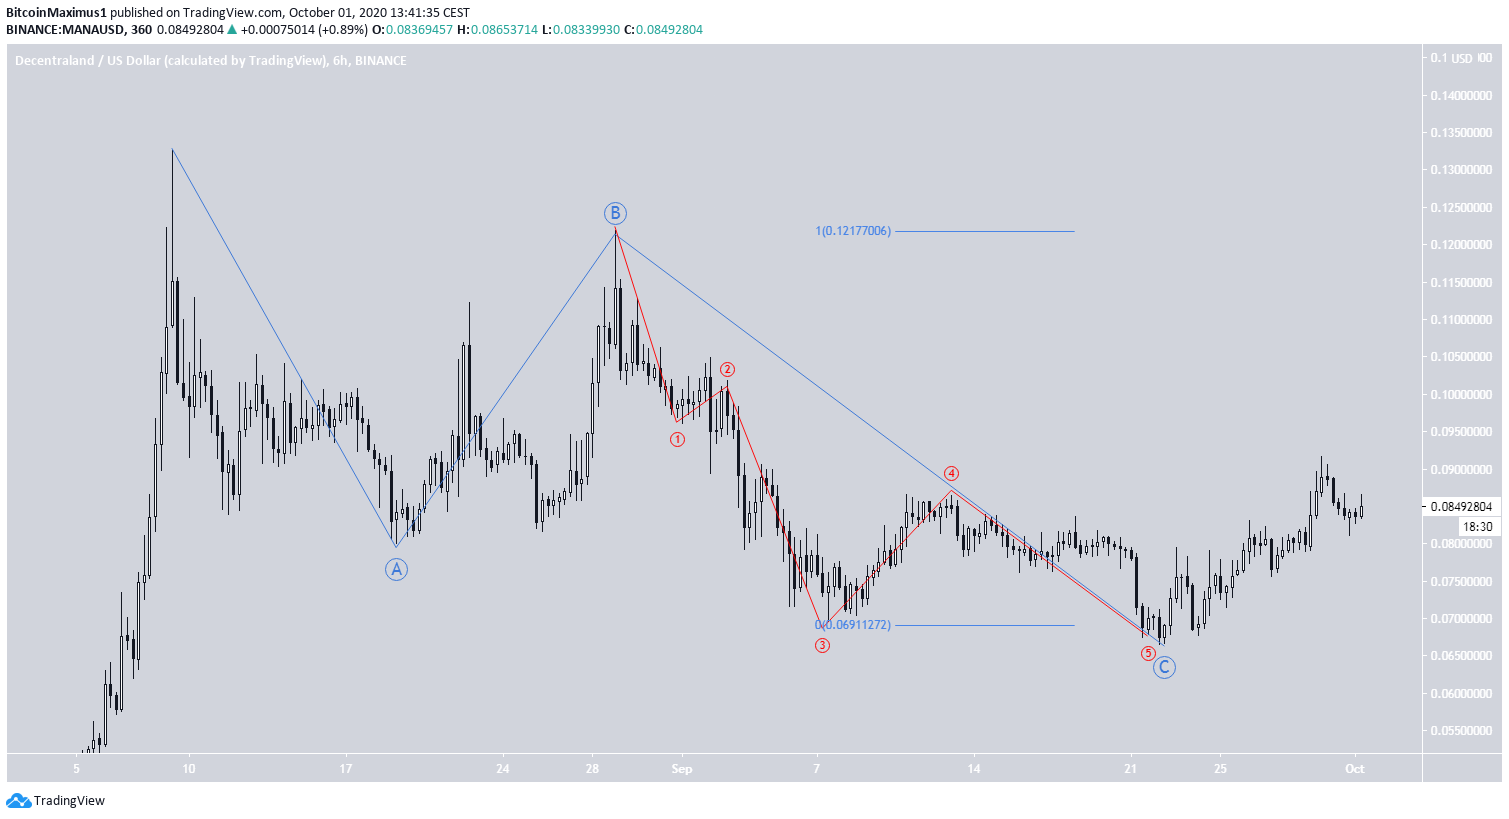
To conclude, whether MANA breaks down below its Sept 21 low or breaks out above the 950 satoshi resistance area will be very important in determining the direction of the future trend.
For BeInCrypto’s Bitcoin analysis, click here!
