
Litecoin (LTC) has been increasing since June 14 but has yet to confirm a potential bullish trend reversal.
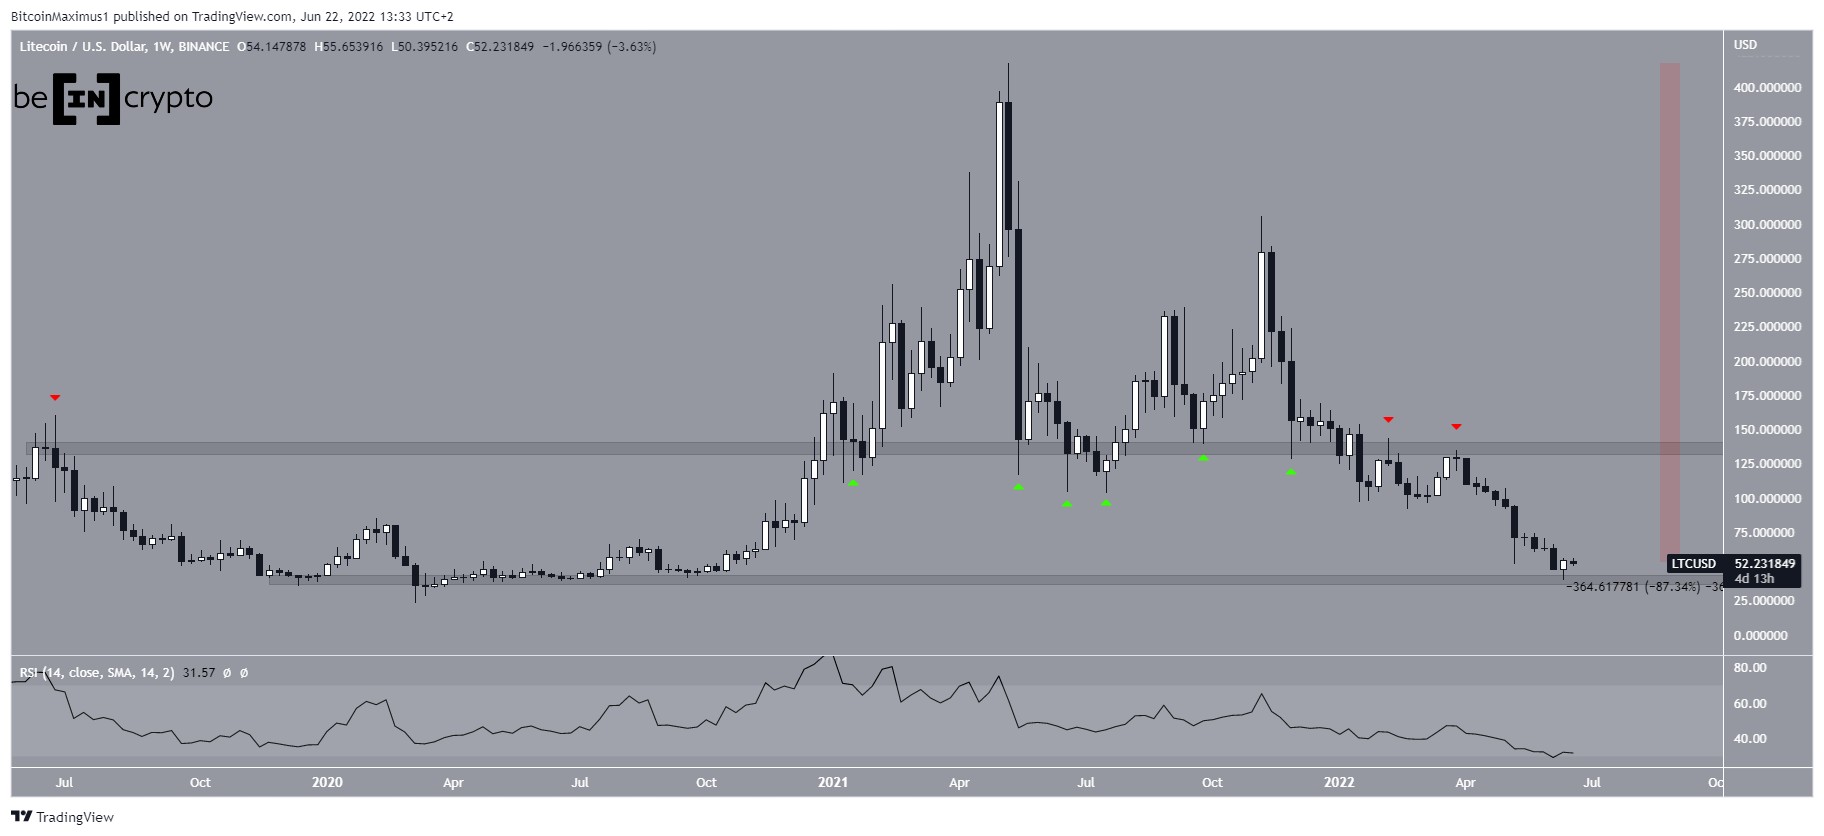
LTC has been falling since reaching a new all-time high price of $417 in May 2021. Initially, the price managed to bounce several times above the $135 horizontal support area. However, it finally broke down at the beginning of 2022, validating the area s resistance (red icons).
SponsoredSo far, the downward movement has led to a low of $40.2 on June 14, 2022. This amounted to a drop of 87% from the aforementioned high. The low was made at the $40 horizontal support area, which was last reached in March 2020.
On top of this, the weekly RSI has fallen to a new all-time low, a sign of an oversold asset.
Short-term resistance line
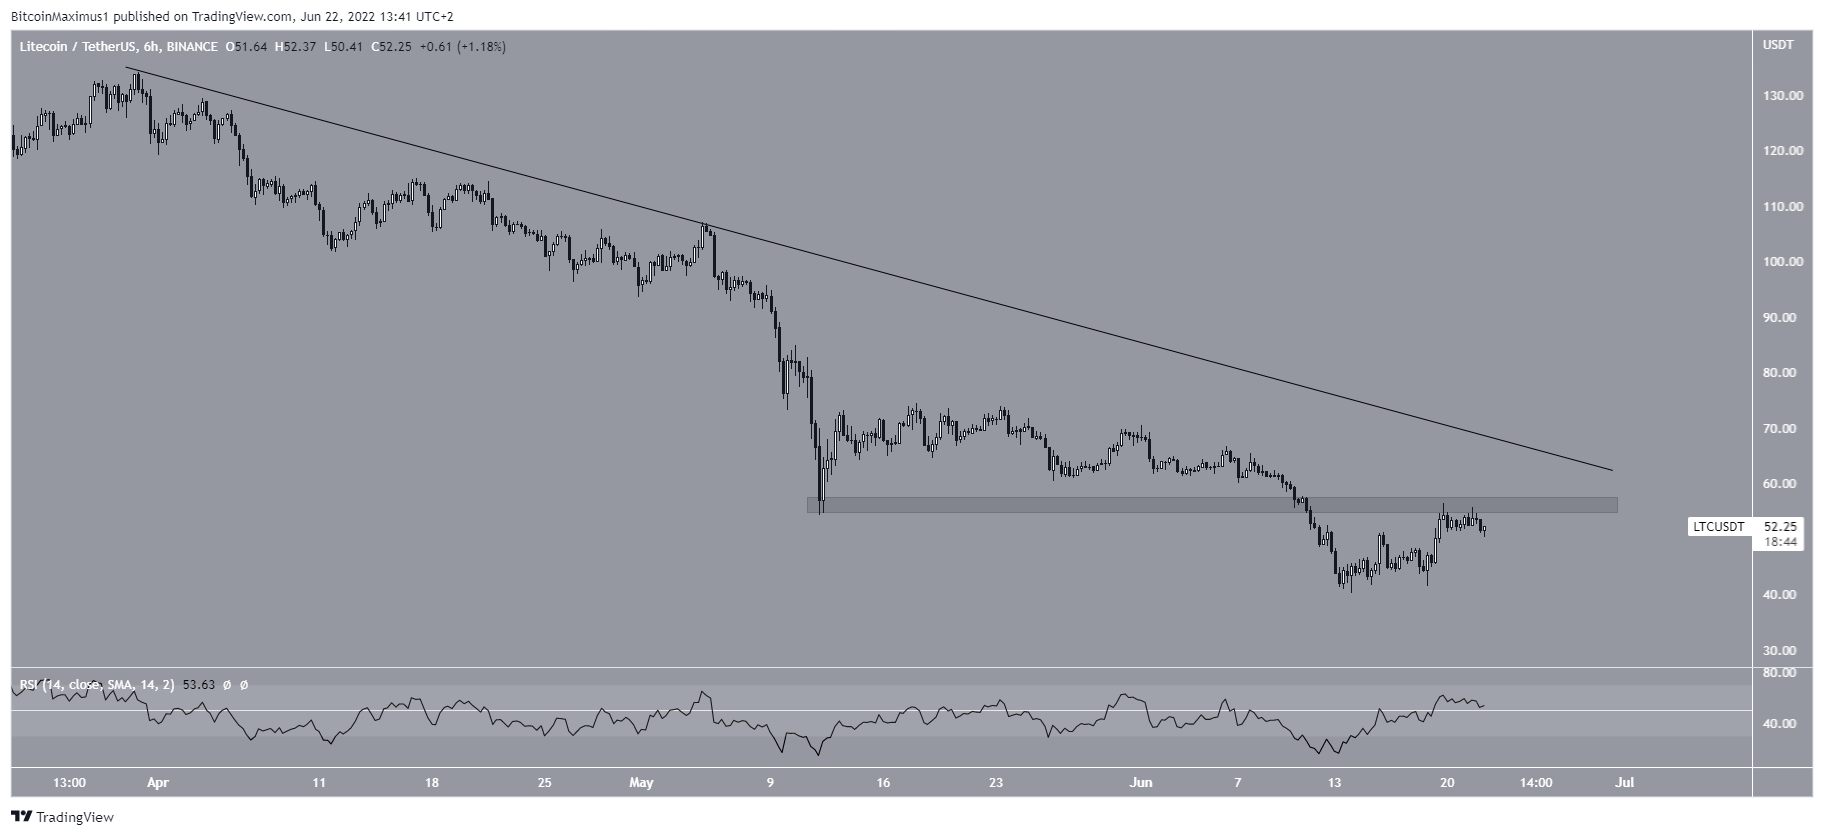
Sponsored SponsoredThe six-hour chart shows that LTC has been falling underneath a descending resistance line since the beginning of April. More recently, the line caused a rejection on May 5.
While the price has been increasing since June 14, it has failed to reclaim the $55 minor resistance area, which now coincides with the aforementioned resistance line. Additionally, the RSI is right at the 50 line, providing a sign of a neutral trend.
So, the six-hour chart provides a somewhat neutral outlook, failing to indicate whether a breakout or rejection will occur.
LTC/BTC
Cryptocurrency trader @traderrocko tweeted that the LTC/BTC chart has increased by 40% since its June lows.
Sponsored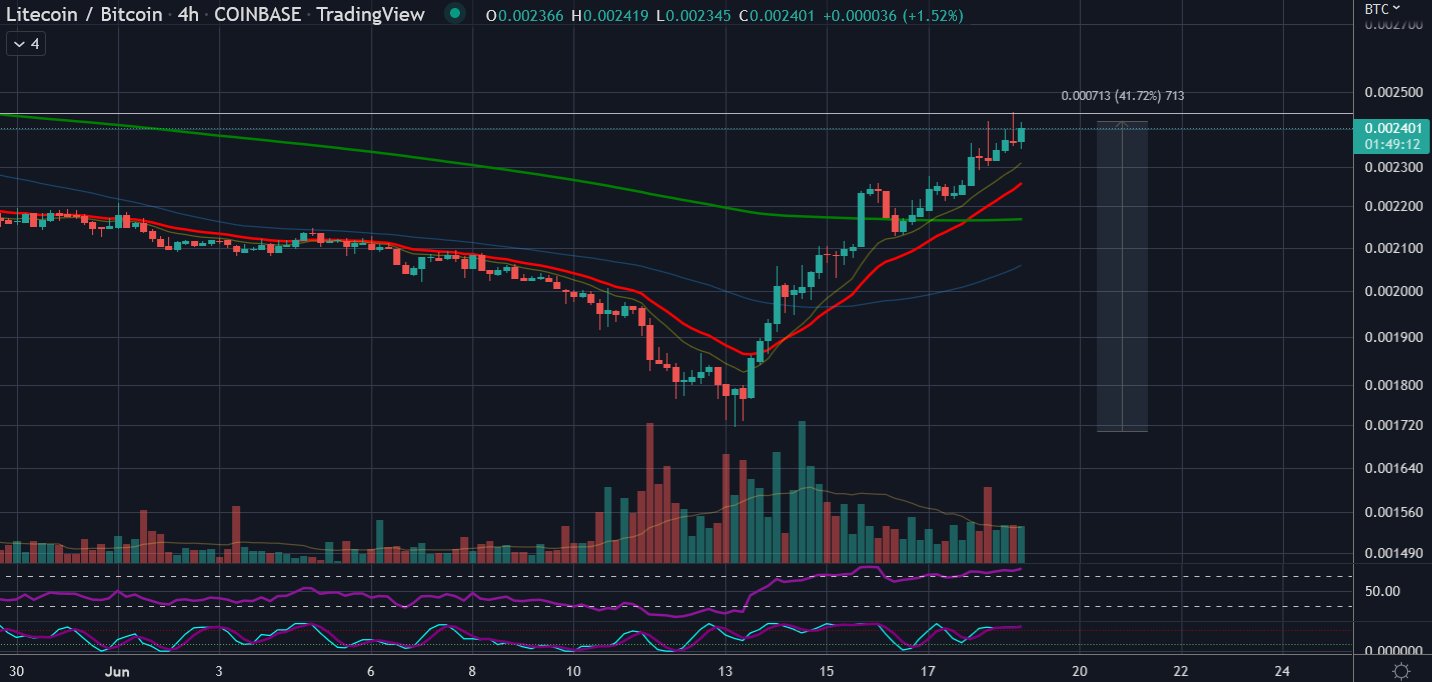
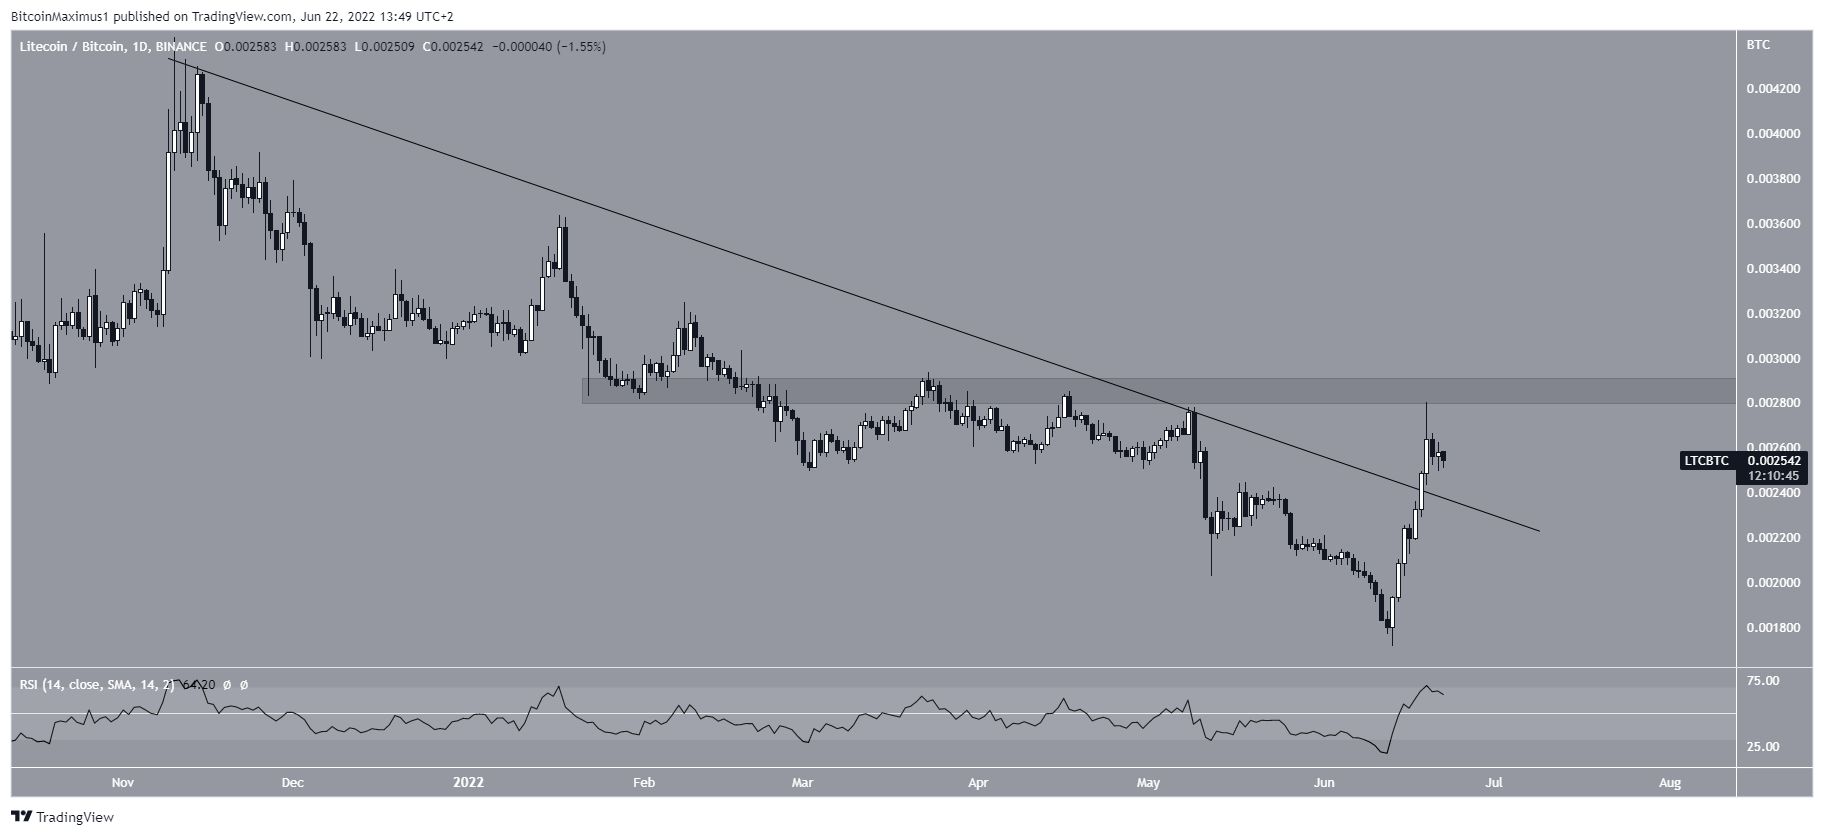
The LTC/BTC chart is more bullish than its USD counterpart. The price has increased significantly since June 14 and broke out from a descending resistance line on June 20.
The closest resistance is at ₿0.00285. This is a crucial level since it has intermittently acted as both support and resistance since the beginning of the year. A movement above it could further accelerate the rate of increase.
For Be[in]Crypto’s latest bitcoin (BTC) analysis, click here
