
On June 4, the Ethereum price (ETH) reached a low of $235.22. Similar levels were reached on June 5 and 6. However, a rapid decrease began on June 9 and the next day the price reached lows of $226.01.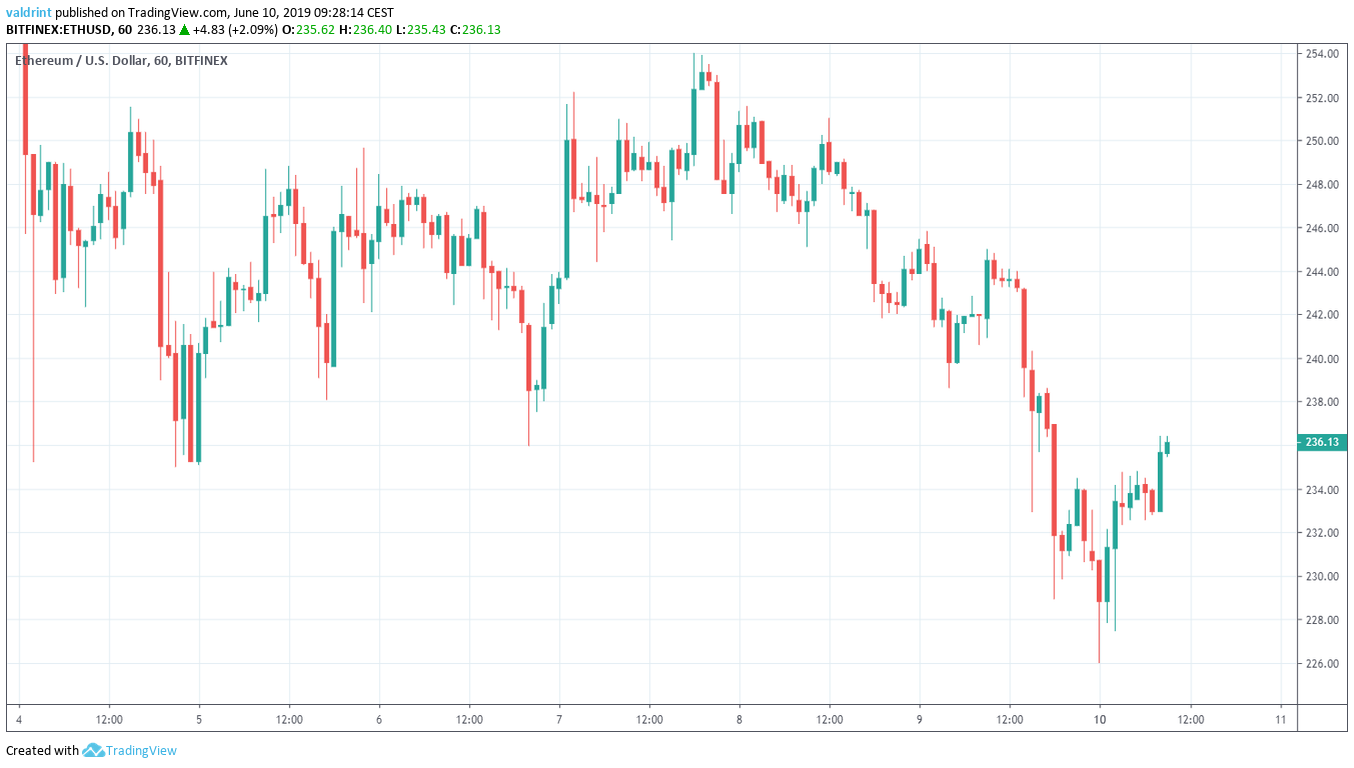
Ethereum has been increasing since.
Below, we are going to analyze the Ethereum price (ETH) in different time-frames and alongside technical indicators, in order to try and predict future movement. You can read our previous analysis here.
Ethereum Price (ETH): Trends and Highlights for June 10
Sponsored- ETH reached a low of $226.01 on June 10.
- It is trading inside a descending wedge.
- There is a short-term bullish divergence developing in the RSI.
- The 10- and 20-day moving averages have made a bearish cross.
- Long-term bearish divergence has developed in the RSI.
- There is resistance near $250.
Descending Wedge
On June 5, ETH/USD reached a low of $238.05 A gradual upward move ensued and ETH’s price reached a high of $253.93 on June 7. Since then, it has been decreasing, creating the descending wedge outlined below:
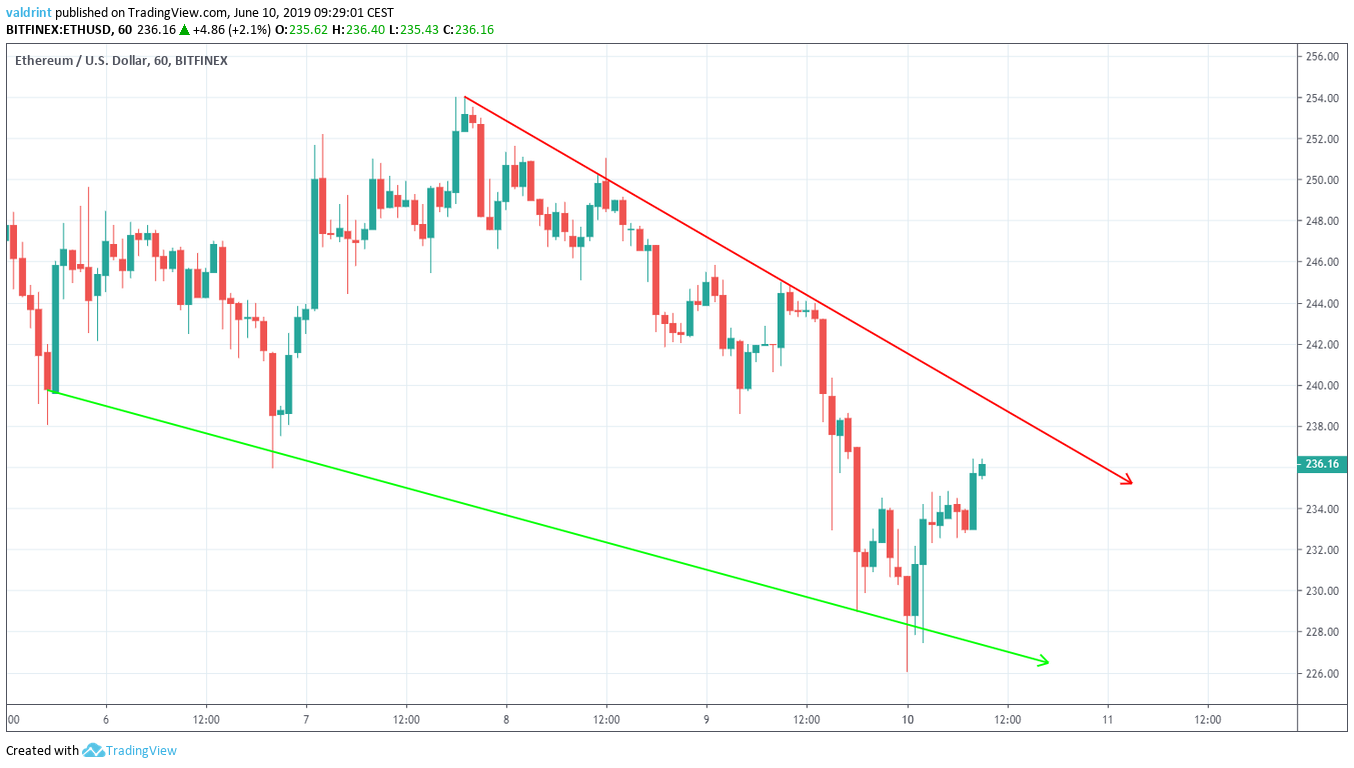
At the time of writing, the Ethereum price (ETH) was trading close to the resistance line of the channel, after bouncing from support in the early hours of June 10.
Will the ETH price break out or are there more decreases in store?
A look at technical indicators is required in order to answer that question.
Sponsored SponsoredEthereum Price (ETH): RSI and Moving Averages
The price of ETH is analyzed at six-hour intervals alongside the RSI below:
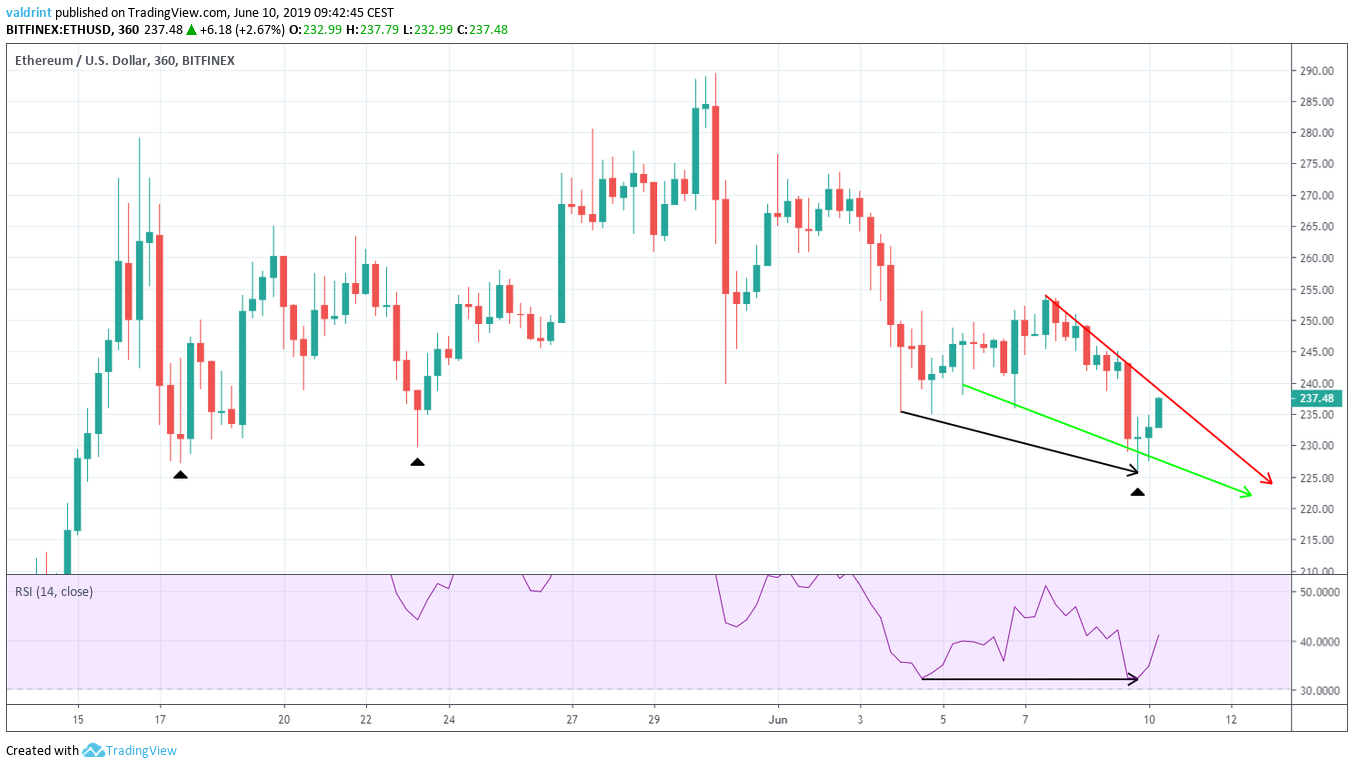
On June 4, the price reached a high of $238.05. It made a lower low of $253.93 on June 7. During this time, instead of generating lower lows, the RSI reached the same level twice. This is known as bullish divergence and often precedes price increases.
Furthermore, the descending wedge is a bullish pattern, making price breakouts more likely.
However, a look at a longer time-frame gives a different outlook:
SponsoredTherefore, we have outlined the Ethereum price (ETH) at daily intervals alongside the RSI and the 10- and 20-day moving averages (MA) below:
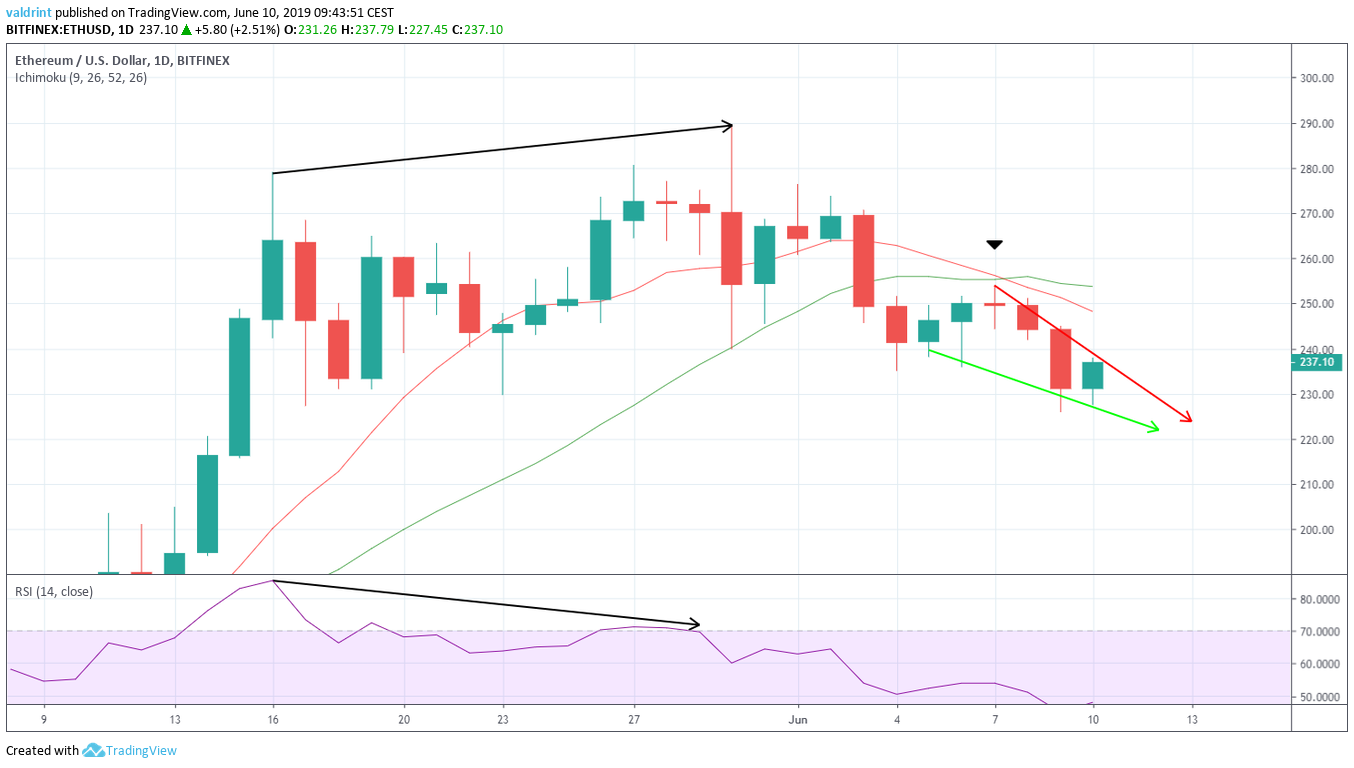
During the highs of May 16 and 30, the RSI generated lower highs. A decrease followed shortly after. A bearish cross between the 10- and 20- day MAs also occurred on June 7. This is often an indication that a downtrend has begun.
The use of these indicators makes it likely that the Ethereum price (ETH) will break out of the wedge. However, ETH is potentially beginning a longer downtrend. Therefore, any increases are likely to be in the short-term only.
If a breakout occurs, where will the price find resistance?
Reversal Areas
Sponsored SponsoredOne resistance area is traced for ETH/USD below:
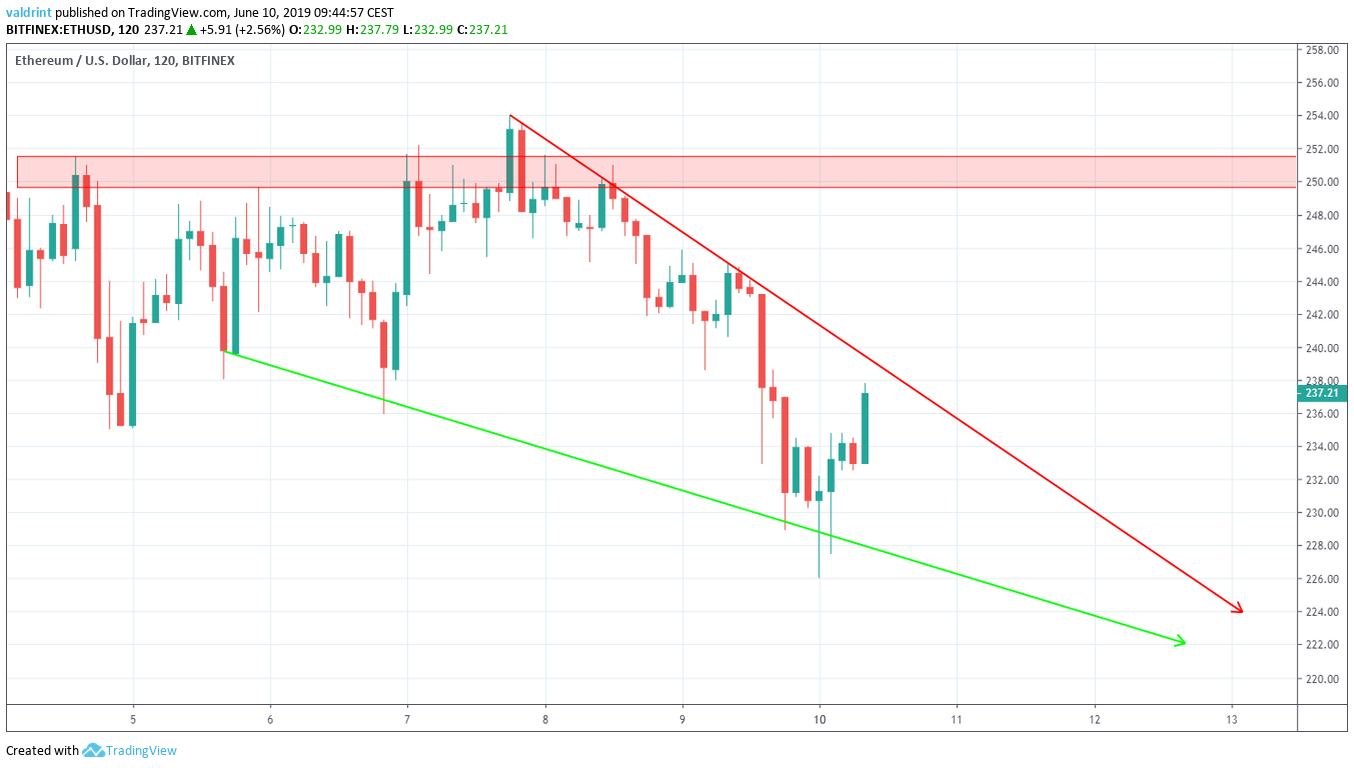
The closest resistance area is found near $250. If the Ethereum price (ETH) breaks out from the wedge, it is likely to reach this area.
Sponsored SponsoredSummary
To conclude, the price of Ethereum (ETH) has recently experienced significant decreases. It is currently trading in a short-term descending wedge. The technical indicators give a positive outlook in the short term but a negative in the long-term.
Do you think the Ethereum price (ETH) will break out from the wedge? Let us know your thoughts in the comments below!
Disclaimer: This article is not trading advice and should not be construed as such. Always consult a trained financial professional before investing in cryptocurrencies, as the market is particularly volatile.
