
BeInCrypto takes a look at the price movement for seven different altcoins, including Ethereum (ETH), which is very close to reaching a new all-time high price.
BTC
Bitcoin (BTC) has been decreasing alongside a descending resistance line since Nov 10, when it reached an all-time high price of $69,000.
The line currently coincides with the $59,300 resistance area, which is also the 0.382 Fib retracement resistance level. A breakout above it would confirm that the short-term correction is complete.
SponsoredLong-term readings suggest BTC will eventually be successful in breaking out.

ETH
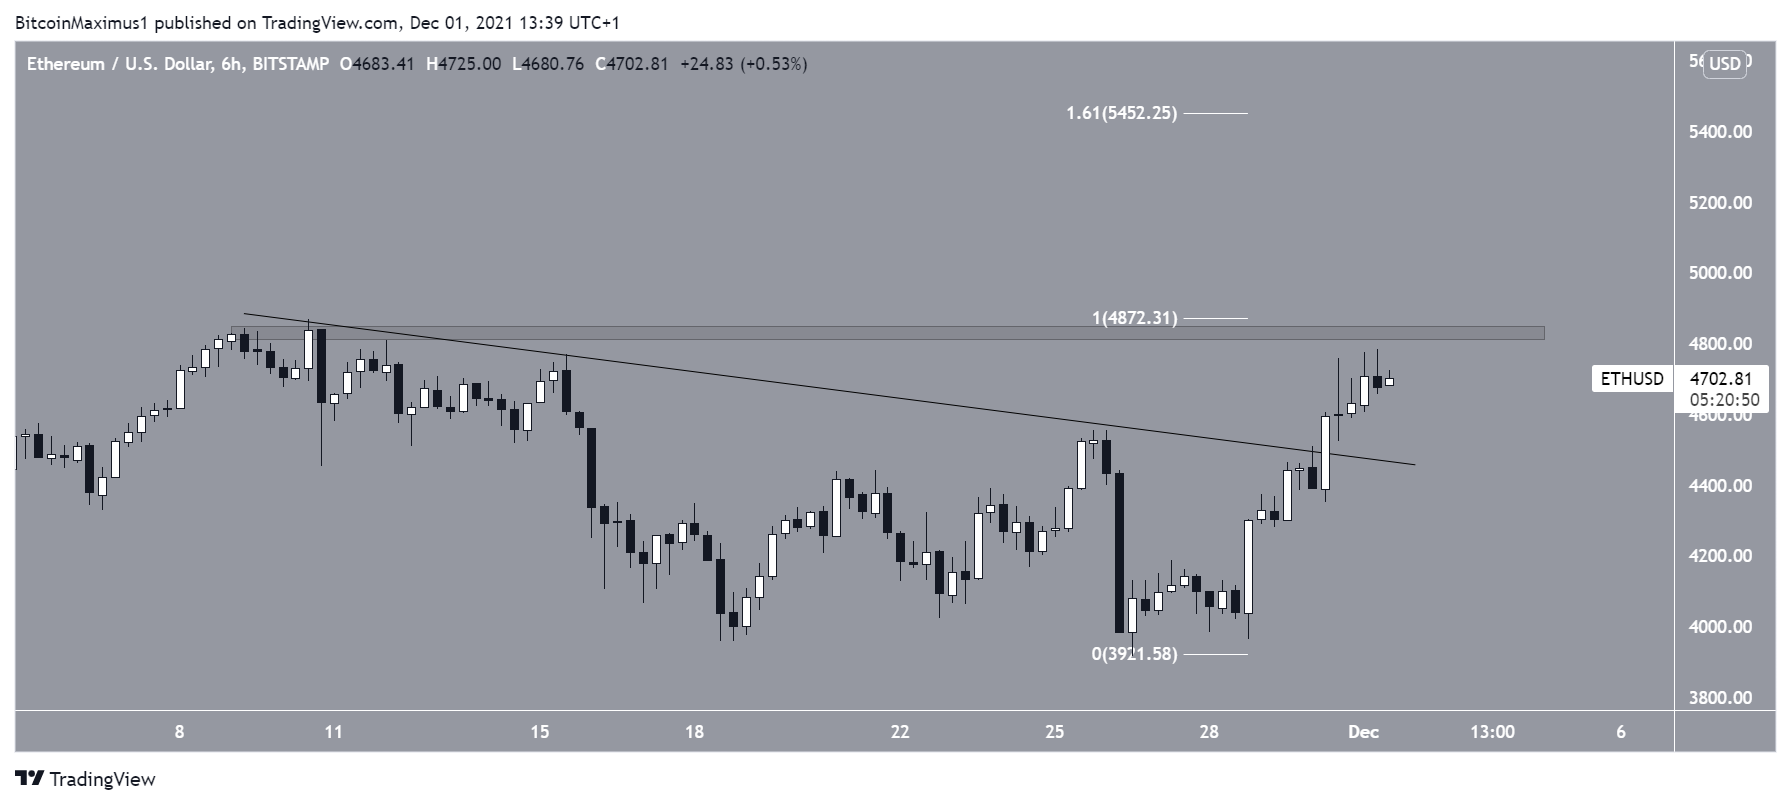
Similarly to BTC, Ethereum (ETH) has also been following a descending resistance line since reaching an all-time high price on Nov 10. However, unlike BTC, ETH has already broken out from the line.
It is currently approaching the all-time high price of $4,868.
If a breakout transpires, the next resistance would be at $5,452.
The ETH/BTC pair looks bullish, indicating that ETH is likely to outperform BTC in the near future.
XRP
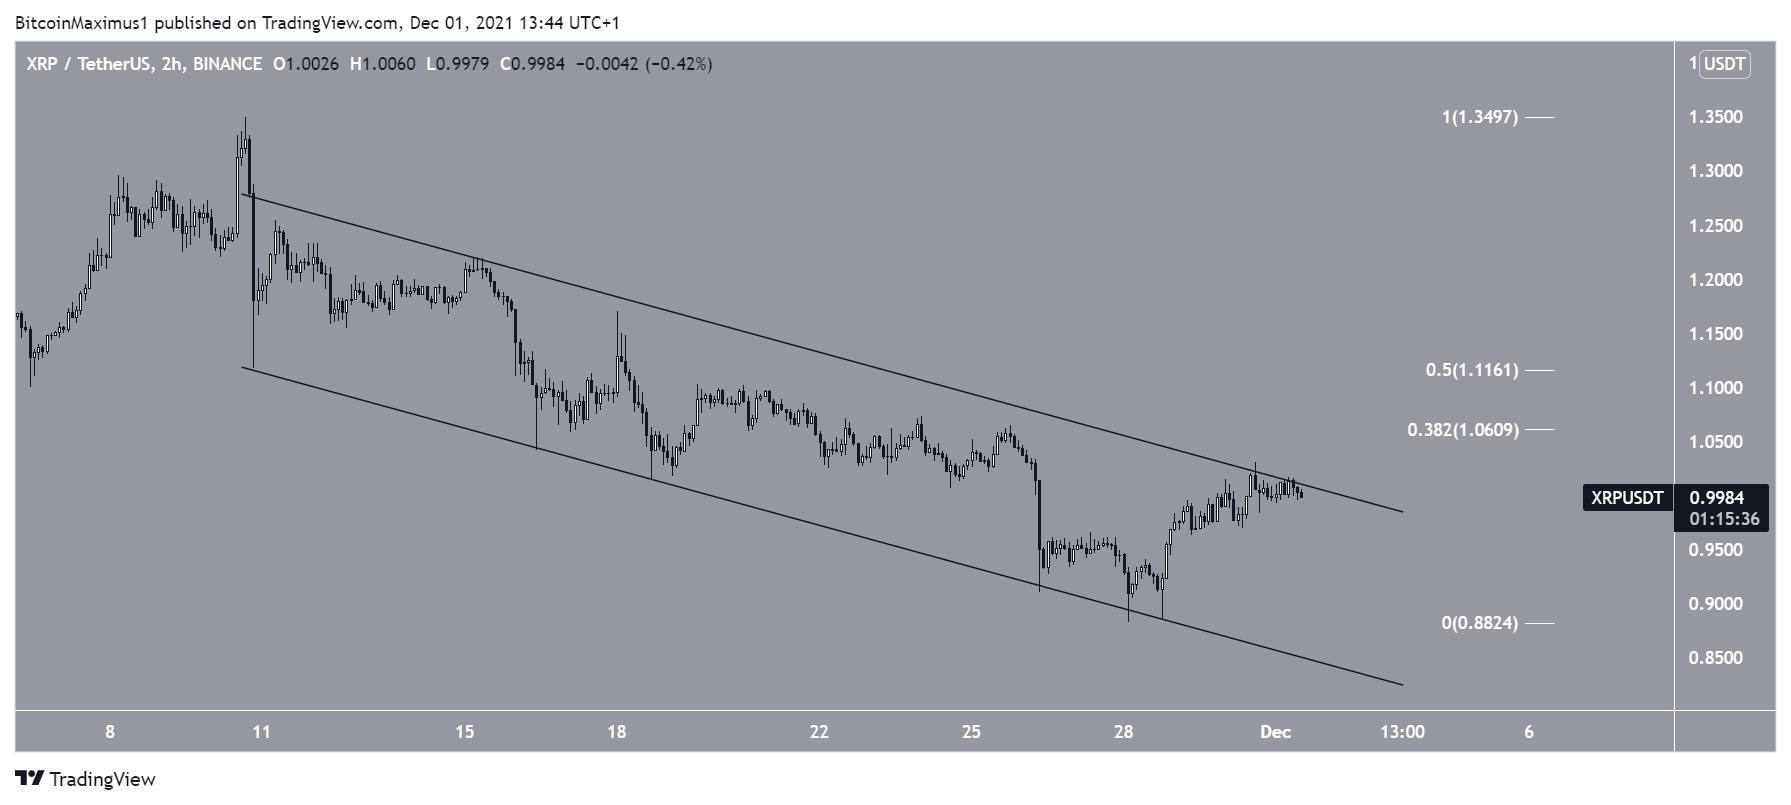
Sponsored SponsoredXRP (XRP) has been trading inside a descending parallel channel since Nov 10. Such channels usually contain corrective movements, meaning that a breakout would be eventually expected.
If one occurs, the closest resistance would be between $1.06 and $1.11.
NEAR
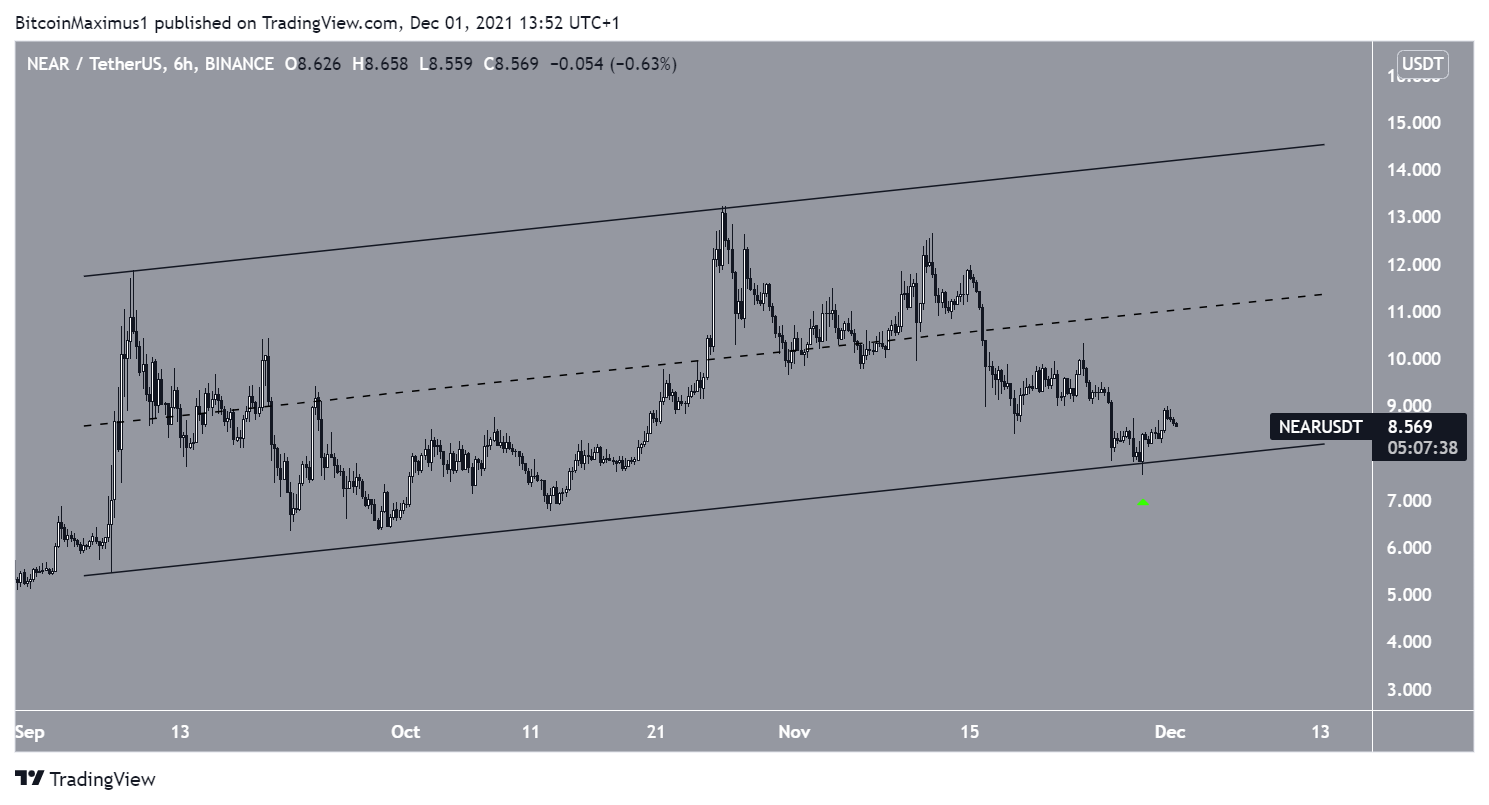
NEAR has been falling since Oct 26, when it had just reached a high of $13.23.
On Nov 28, it bounced after reaching a low of $7.53. The bounce (green icon) served to validate the support line of an ascending parallel channel. As long as the token is trading above this line, the bullish structure remains intact.
A reclaim of the middle of the channel would be a bullish sign, suggesting that an eventual breakout is likely.
MANA
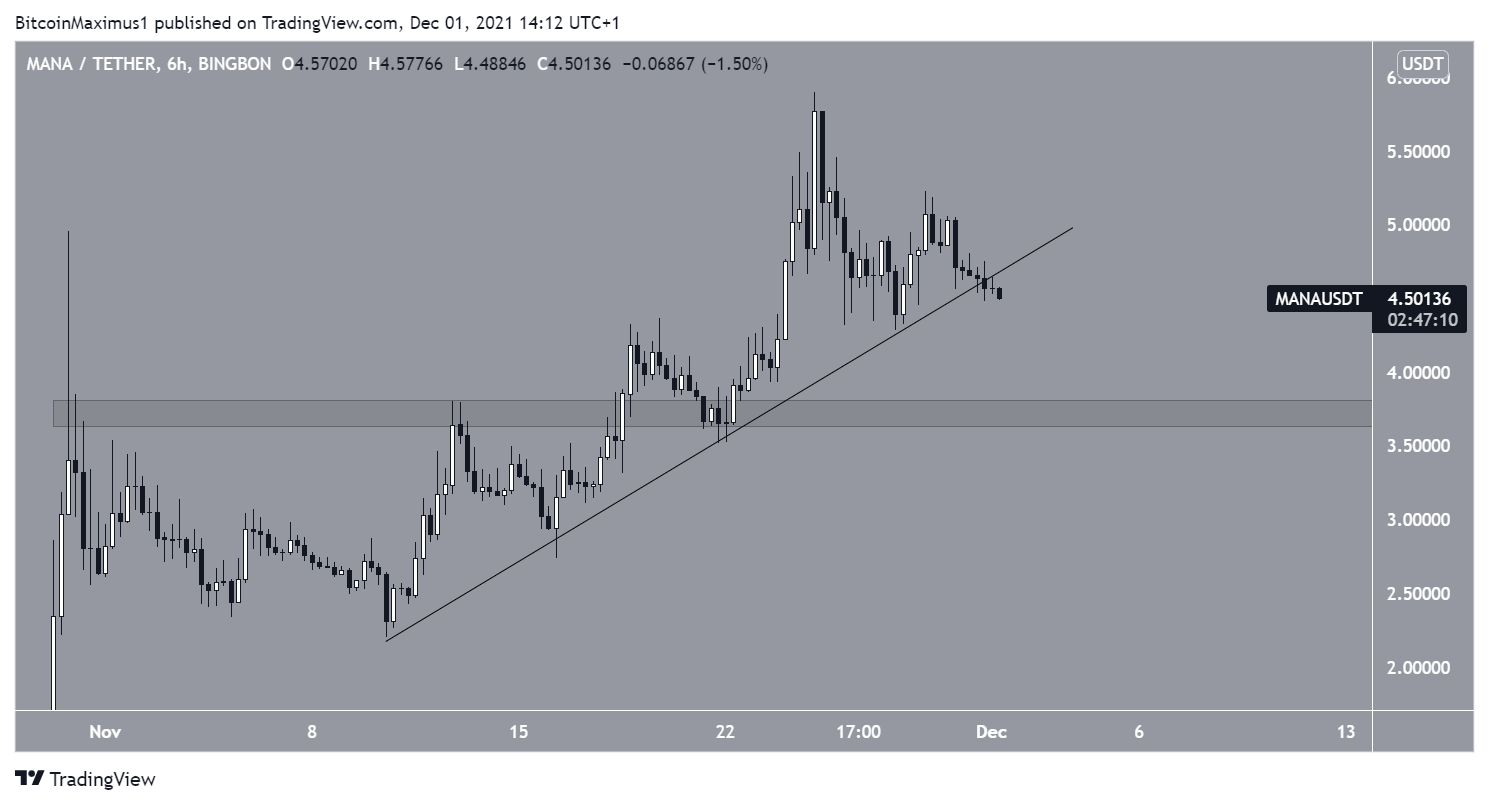
MANA has been increasing alongside an ascending support line since Nov 10. This led to a new all-time high price of $5.90 on Nov 25.
However, the token has been falling since, and is at risk of breaking down from the ascending support line.
If it does, it could fall all the way down to the closest support area at $3.70.
LSK
LSK has been increasing alongside an ascending support line since the end of August. More recently, it bounced at the line on Sept 29 and Nov 19 (green icons).
Sponsored SponsoredThe token is also facing resistance at $3.80. When combined with the ascending support line, this creates an ascending triangle, which is considered a bullish pattern.
A breakout from it would take the token towards the Aug highs at $5.50.

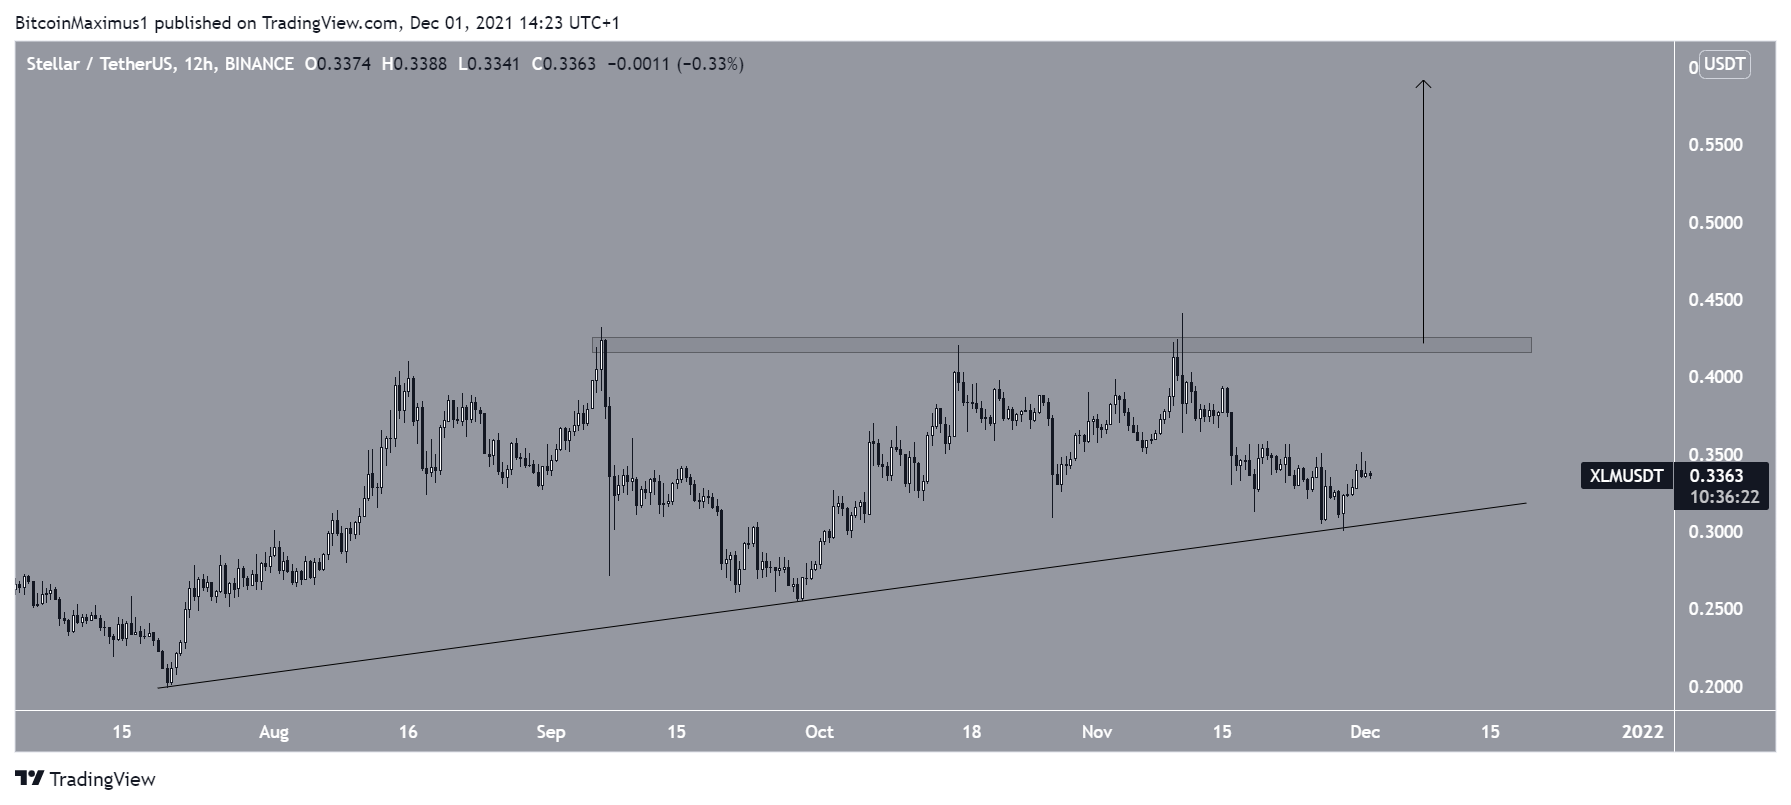
XLM
Sponsored SponsoredSimilarly to LSK, XLM is also following an ascending support line. It has been doing so since July 20.
When combined with the $0.425 resistance area, it creates an ascending triangle.
A breakout that travels the entire height of the pattern would take XLM all the way to $0.60.
For BeInCrypto’s latest Bitcoin (BTC) analysis, click here.
