
The Ethereum price (ETH) began an upward move on May 15. It reached a high of $279 the next day. A gradual decrease ensued, which was followed by an increase. A high of $289 was reached on May 30.
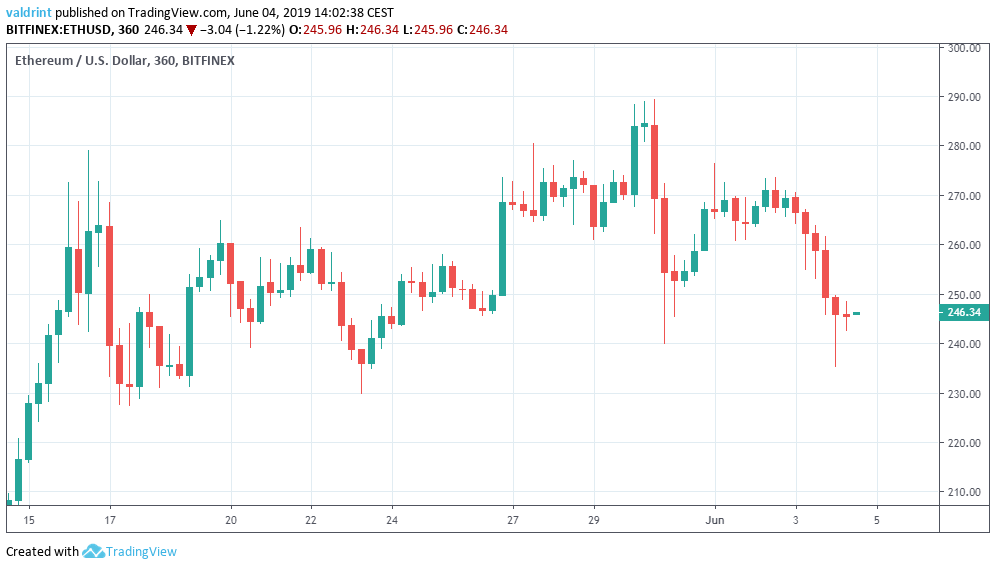
Since then, the price has been decreasing, reaching lows below $240 on Jun 4.
Where will it go next? Let’s find out.
SponsoredEthereum Price (ETH): Trends and Highlights for June 4
- Ethereum’s price reached a high of $289 on May 30.
- It is trading inside an ascending channel and a short-term descending wedge.
- There is bearish divergence developing in the RSI.
- The price is trading below the 10- and 20-day moving averages.
- There is resistance near $275.
- There is support near $200.
Ascending Channel
On May 16, ETH/USD reached a high of $279.1. A rapid decrease took it to a low of $227.2 the next day. The price has been increasing since, trading inside the ascending channel outlined below:
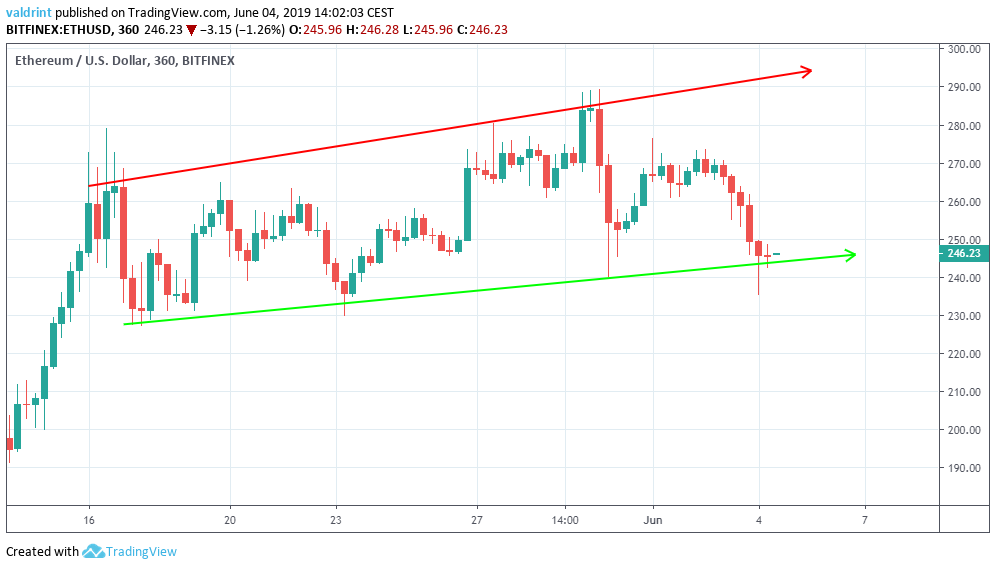
On Jun 4, the price reached a low of $235.22, breaking down from the channel. However, it immediately rebounded and closed the candle slightly above the support line of the channel.
Therefore, we consider the pattern still intact.
Descending Wedge
On May 26, the Ethereum price (ETH) reached a low of $245.55. It immediately began an upward move which took it to a high of $289.42 on May 30. A rapid decrease ensued. Since then, the price has been creating lower highs and lows.
Tracing these highs and lows gives us a descending wedge:
Sponsored Sponsored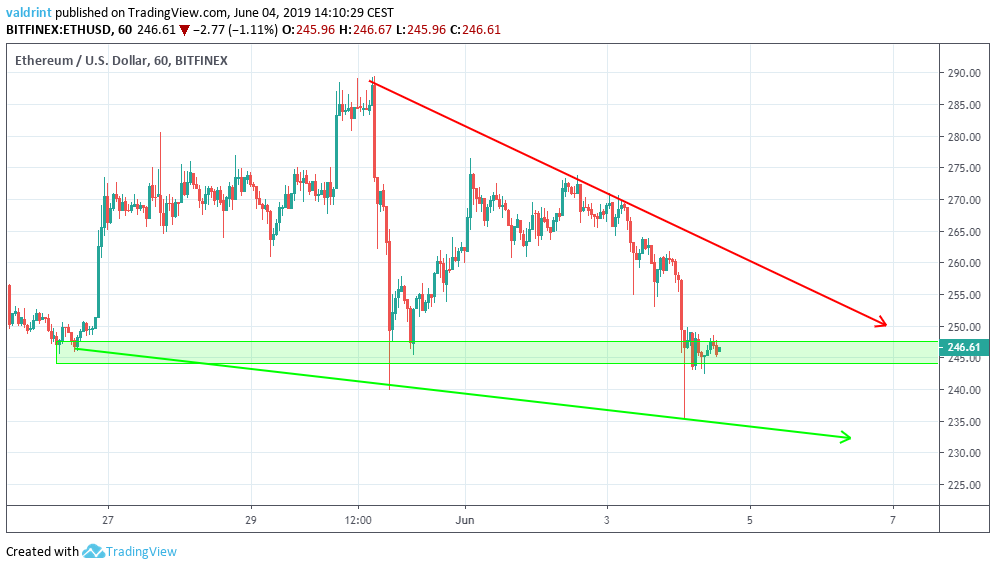
Furthermore, the price has created a support area near $245. This area coincides with the beginning of the wedge and the support line of the long-term ascending channel in the previous section.
Will the Ethereum price (ETH) break down?
In order to answer that, we will combine both patterns and add technical indicators.
Moving Averages
The price of Ethereum (ETH) is analyzed at daily intervals alongside the 10-day and 20-day moving averages (MA).
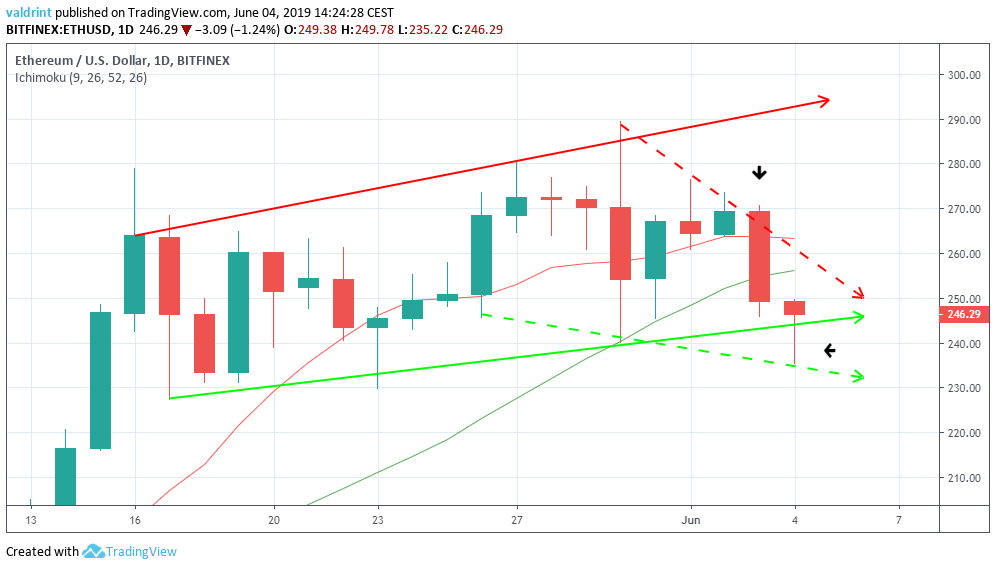
On Jun 3, the Ethereum price (ETH) began a rapid downward move and created a bearish engulfing candle.
This decrease dropped the price below both MAs, which are now providing resistance. This is a bearish sign.
However, a bearish cross has yet to occur.
Bearish Divergence
The Ethereum price (ETH) is analyzed alongside the RSI below:
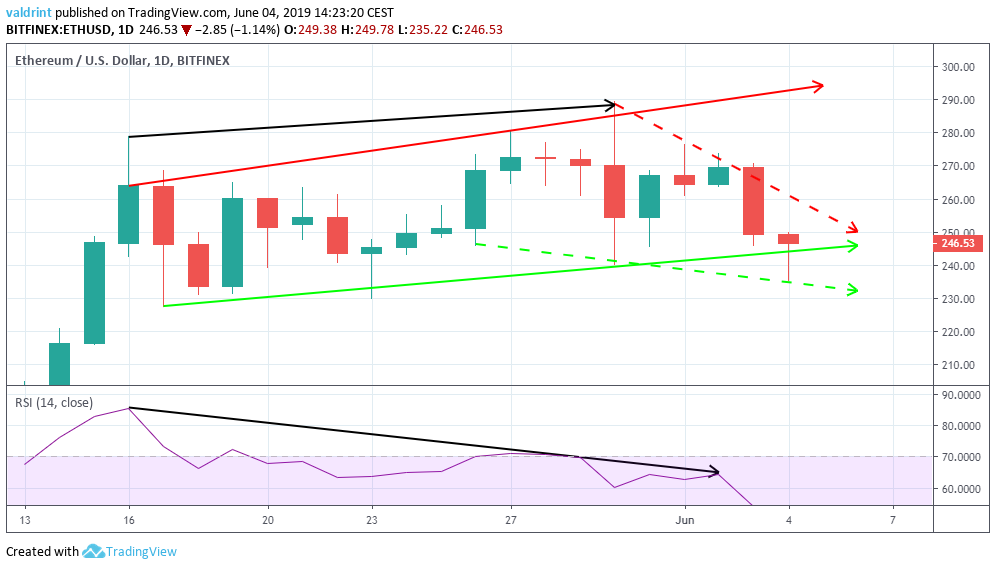
The price reached higher highs on May 16 and 30. During this period, the RSI generated lower highs.
This is known as bearish divergence and often precedes price decreases. In the case of ETH, it preceded the downward move beginning from the high of $289.42. We cannot state with certainty whether this will be enough to trigger a breakdown.
Sponsored SponsoredIf a bearish cross were to occur between the MAs in the previous section, it would provide further support for this hypothesis.
Reversal Areas
One support and one resistance area is traced for ETH/USD below:
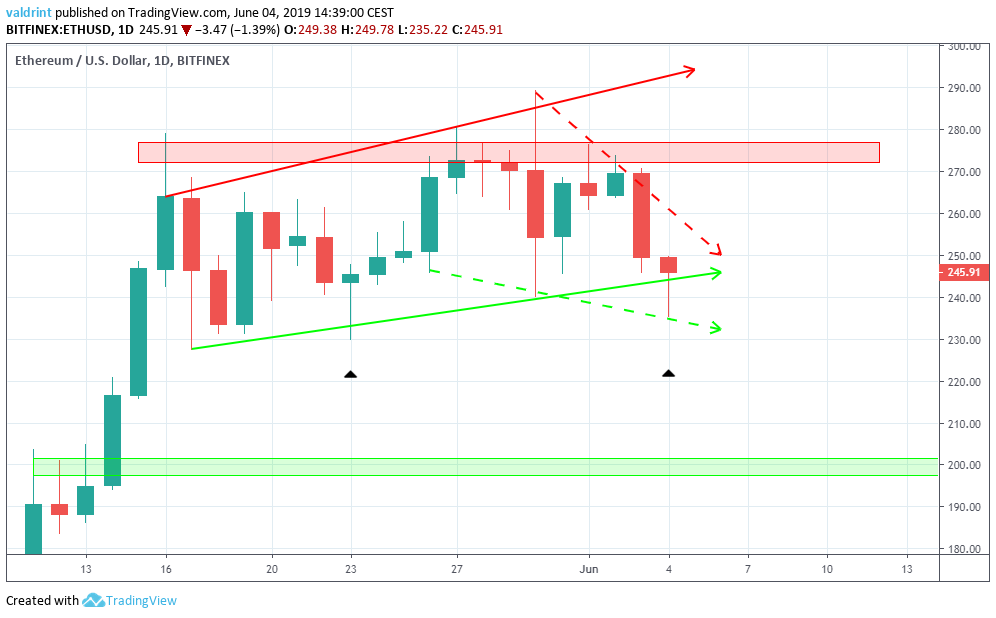
The closest resistance area is found near $275. A breakout from the wedge would be required for the Ethereum price (ETH) to reach this target. The analysis of the technical indicators does not support this movement. However, a similar candlestick was created on May 23, preceding an upward move. If the price were to close above $250, it would give more credence to this possibility.
On the other hand, the closest support area is found near $200. If the Ethereum price breaks down from the channel and/or wedge, it is likely to reach this area. The analysis of technical indicators supports this possibility, although not necessarily in the short-term.
Summary
To conclude, the Ethereum price (ETH) has recently experienced significant decreases. Furthermore, the technical indicators paint a bearish picture. However, a breakdown from the current pattern has yet to occur.
Disclaimer: This article is not trading advice and should not be construed as such. Always consult a trained financial professional before investing in cryptocurrencies, as the market is particularly volatile.
