
While EOS (EOS) is still trading inside a crucial long-term resistance level, there are several signs in various time frames that suggest a breakout is expected.
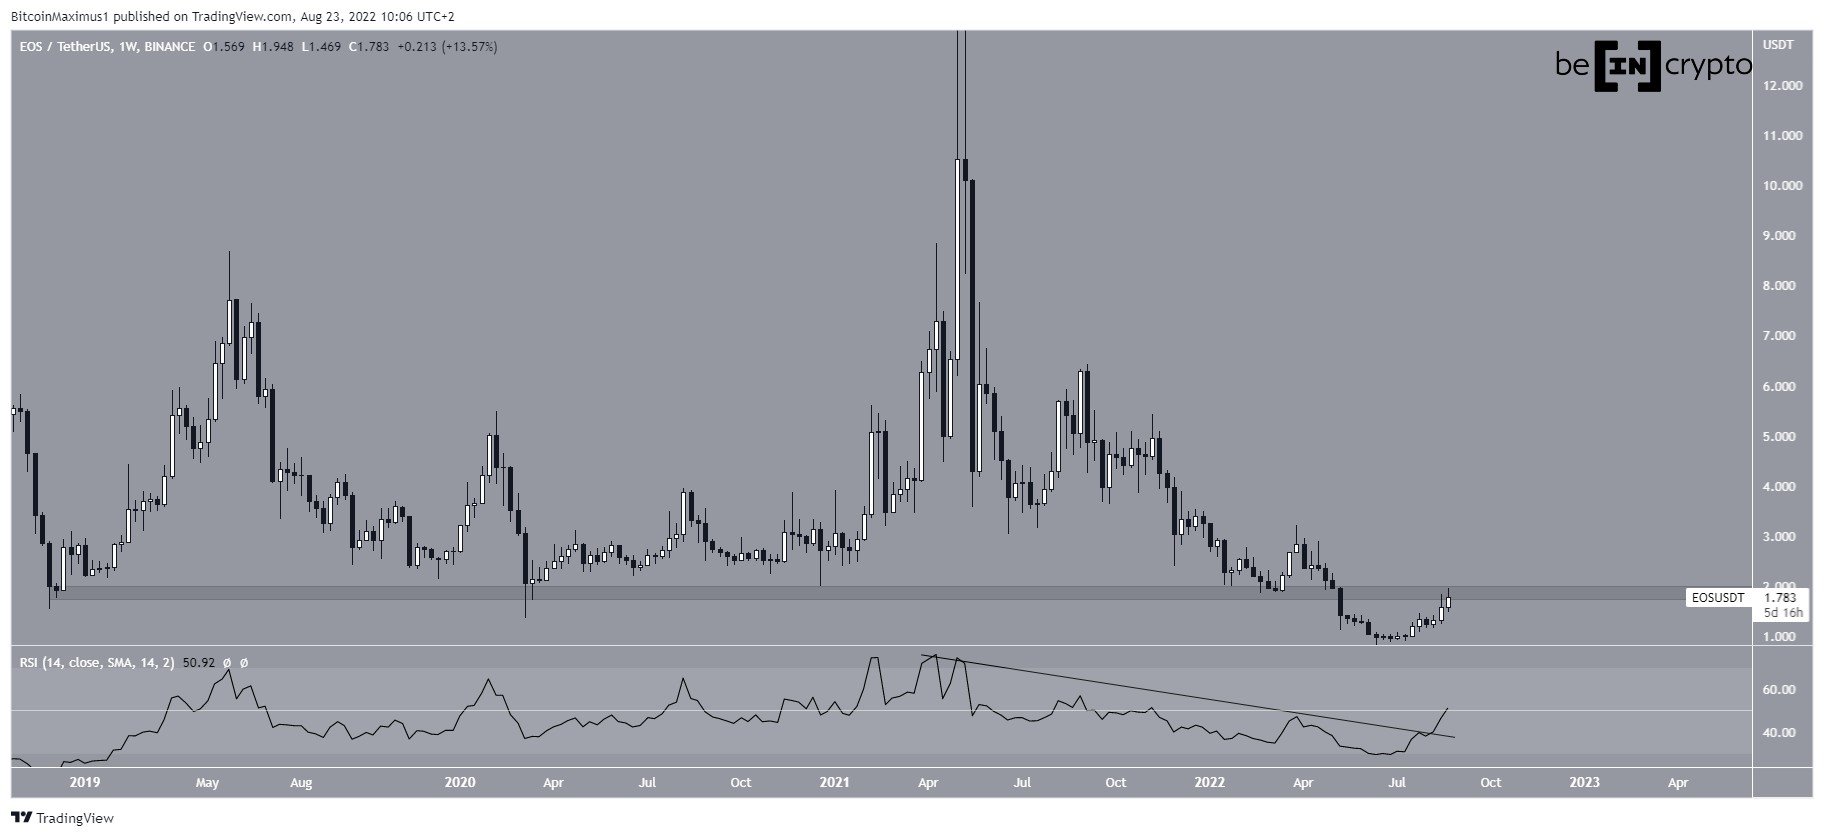
EOS has been decreasing since reaching a high of $14.90 in May 2021. The downward movement led to a new all-time low price of $0.81 in June. The price has been increasing since and so far has reached a high of $1.95.
The high was made inside the $1.90 resistance area, which is a crucial horizontal level. The area had previously acted as support since Dec 2018. So, its reclaim would be crucial for the continuation of the upward movement.
SponsoredThe weekly RSI supports the possibility of a reclaim, since it has broken out from its own descending resistance line. Currently, it is attempting to move above the 50 line.
So, a reclaim of the $1.90 area alongside a weekly RSI movement above 50 would indicate that the long-term trend is bullish.
Current pattern
Sponsored Sponsored
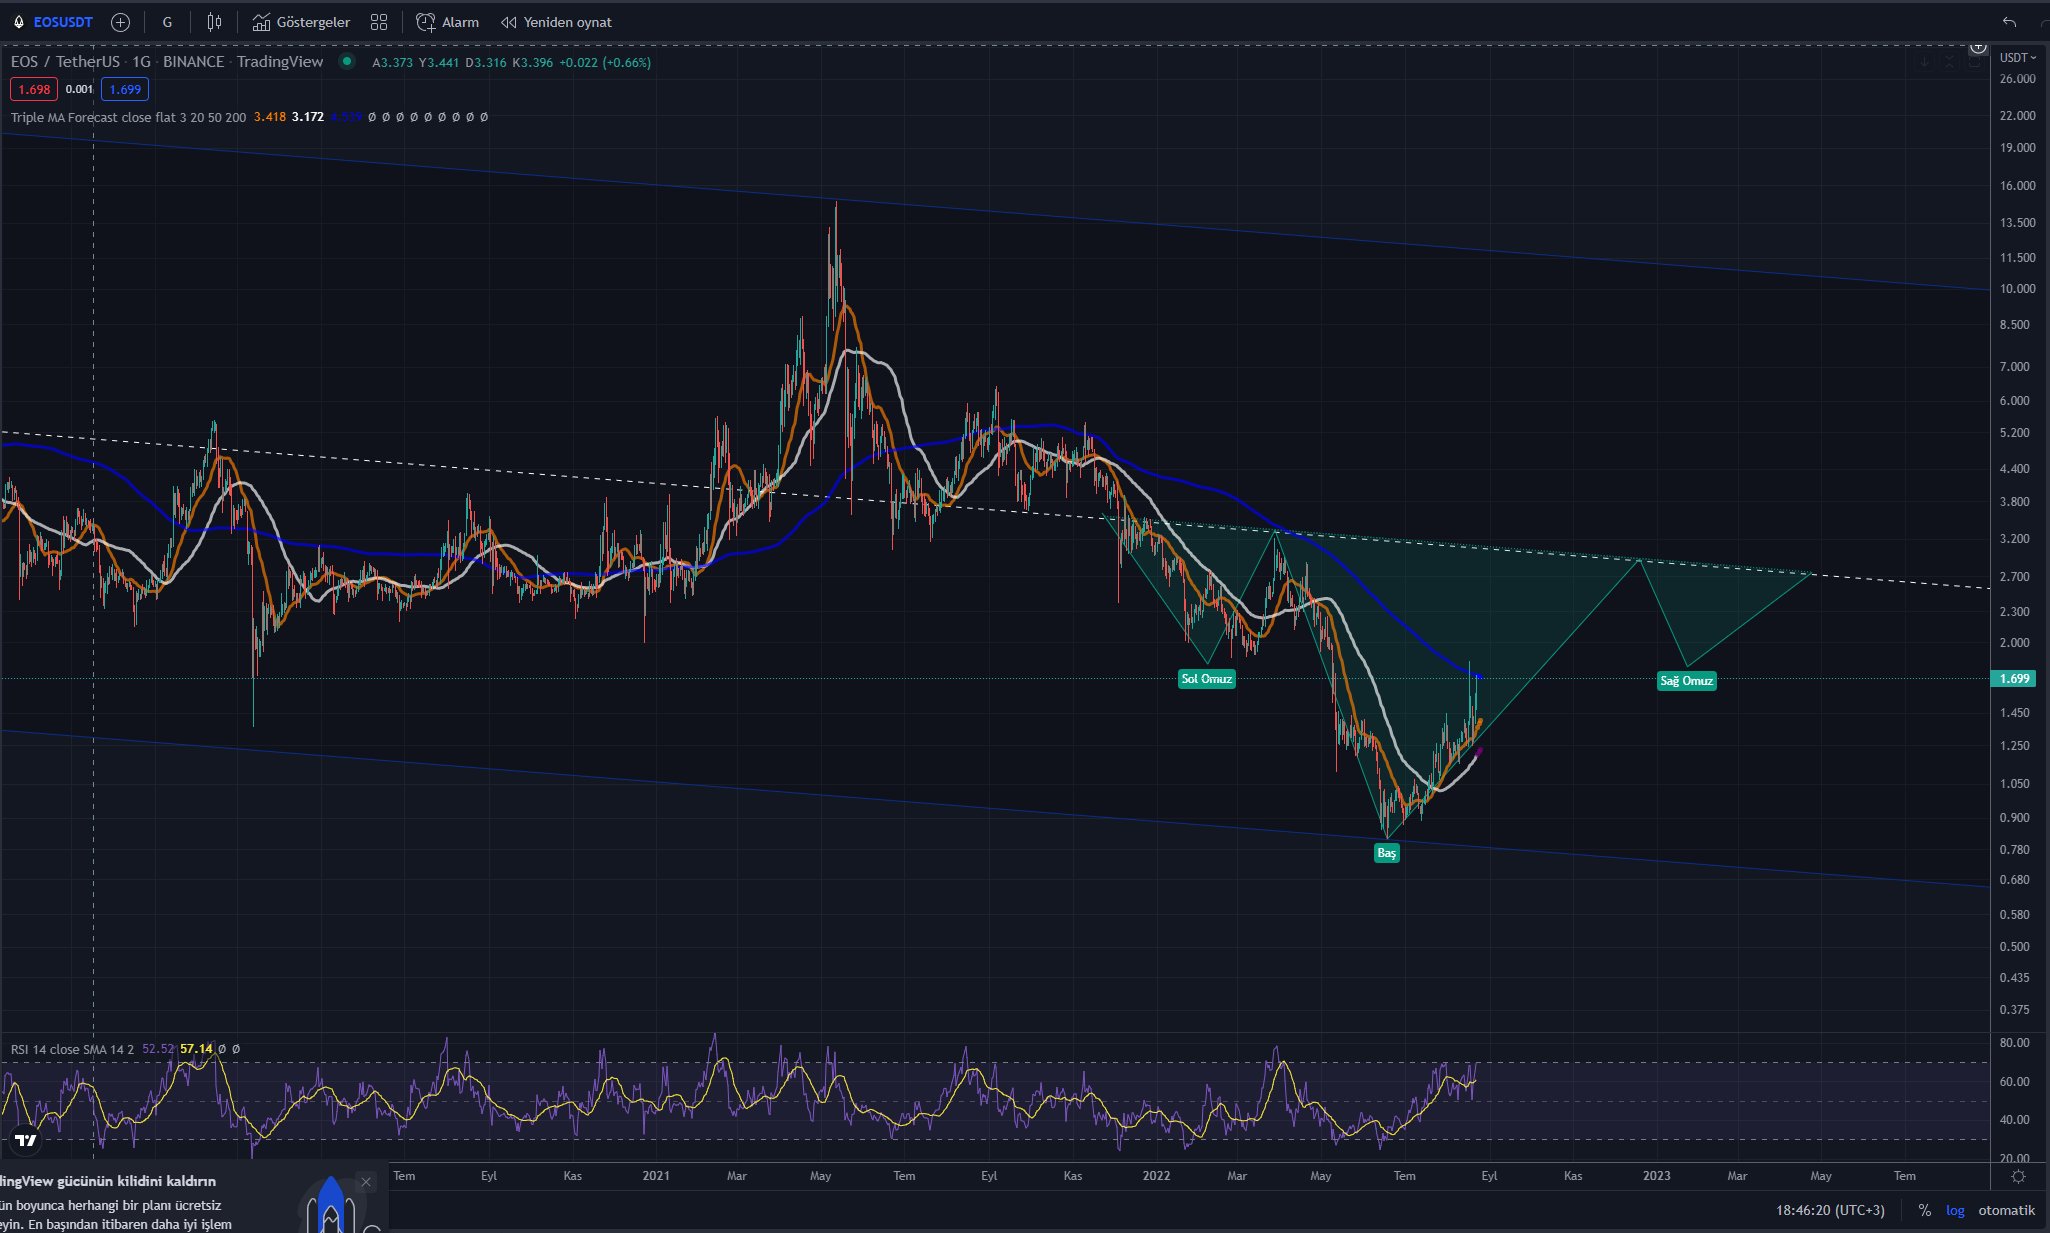
Cryptocurrency trader @ersel_karaduman tweeted a chart of EOS, stating that the price could be completing an inverse head and shoulders, which is considered a bullish pattern.
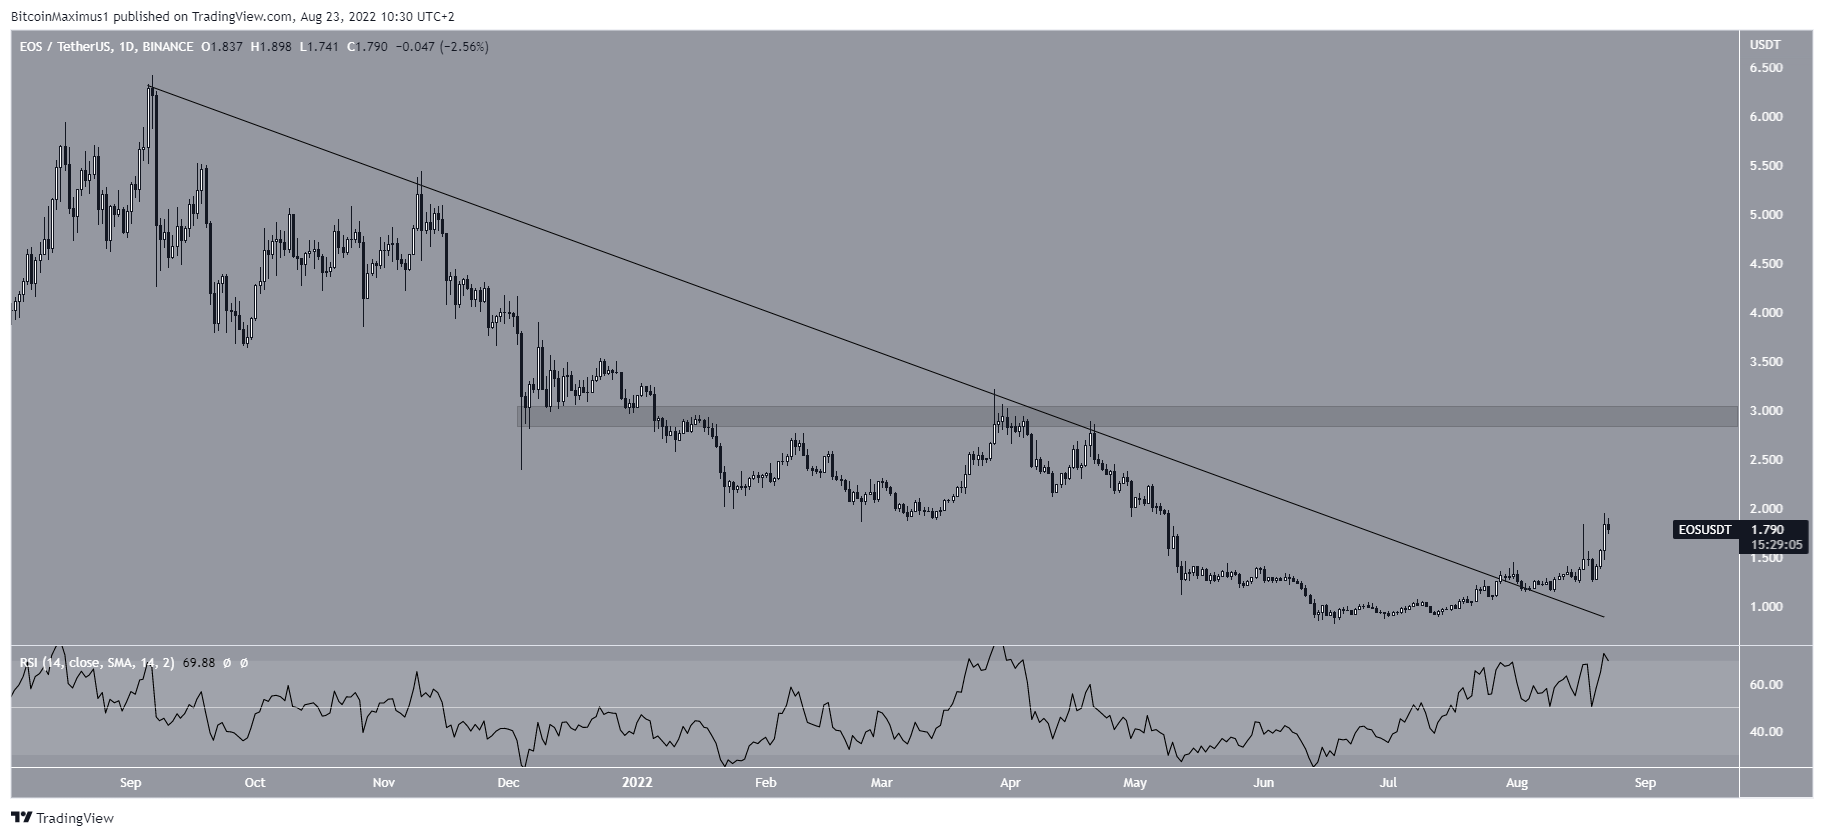
While the inverse head and shoulders pattern is not yet confirmed, the daily chart shows a breakout from a descending resistance line that had previously been in place since Sept 2021. Breakouts from such long-term structures usually indicate that a new trend has begun.
Furthermore, the daily RSI is still increasing and is comfortably above 50. Moreover, there is no bearish divergence in place.
If the $1.90 area is reclaimed, there is virtually no more resistance until $2.90.
Future EOS movement
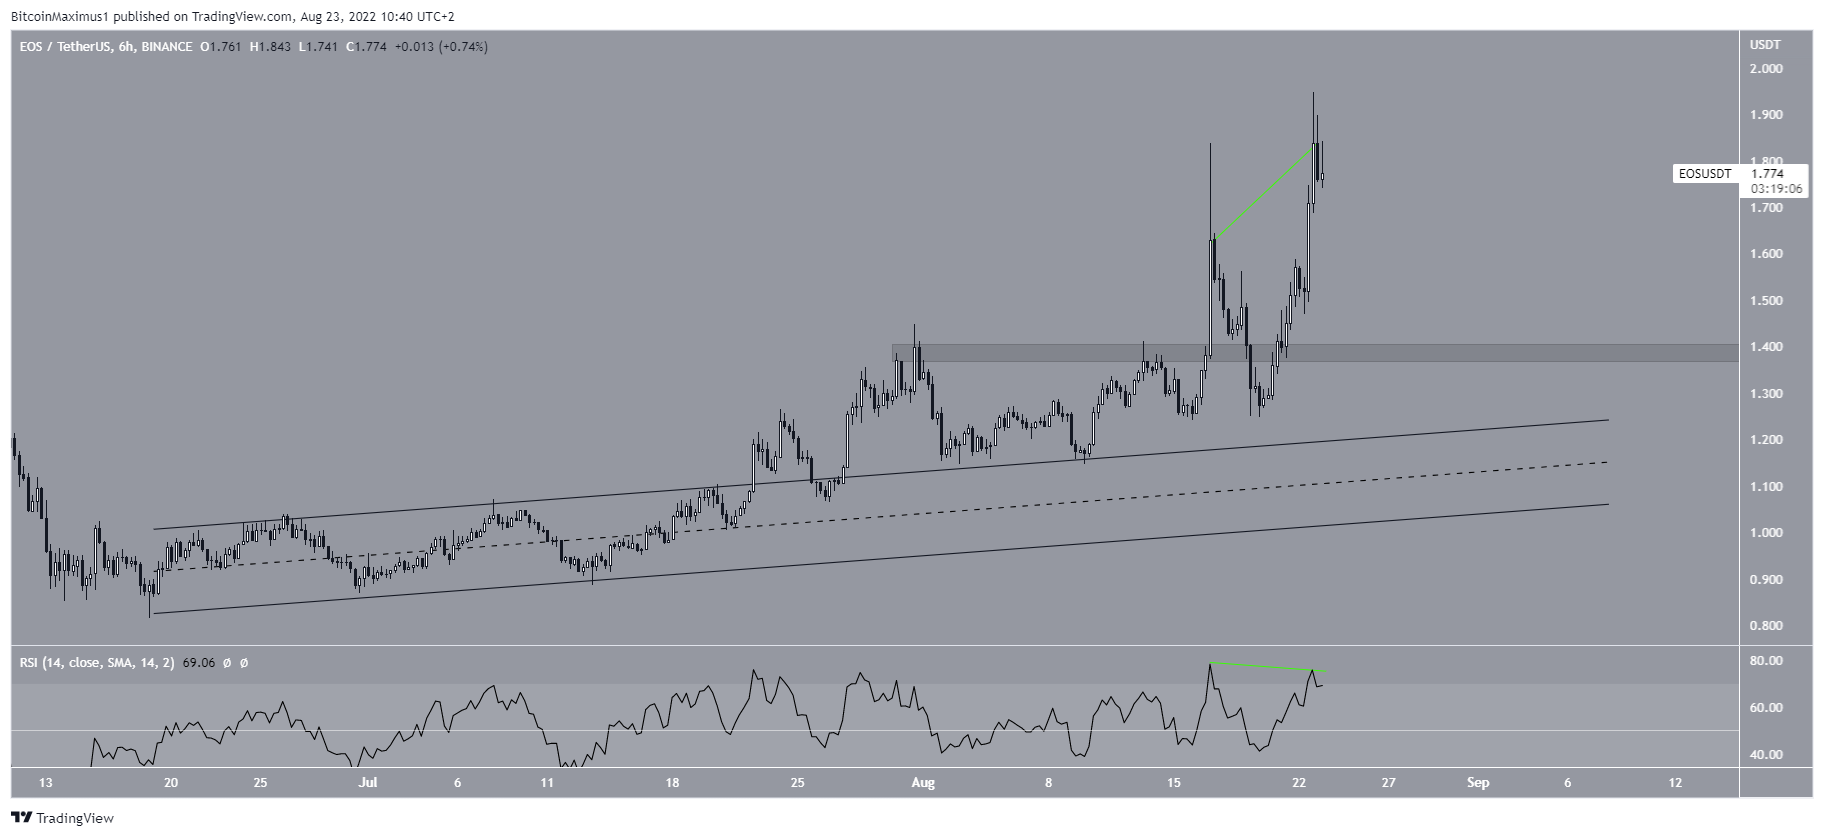
SponsoredWhile both the weekly and daily charts are bullish, the six-hour chart indicates that an initial decrease could occur prior to the continuation of the upward movement.
The main reason for this is the creation of a double top pattern that has been combined with bearish divergence in the six-hour RSI (green line).
If a retracement occurs, the $1.40 area could provide support. If EOS falls below it, the resistance line of the previous channel at $1.30 would likely initiate a bounce.
Afterward, the upward movement would be expected to continue.
For Be[in]Crypto’s latest Bitcoin (BTC) analysis, click here
