
Even though EOS (EOS) has bounced considerably since its Dec 4 lows, it has a long way to go in order to confirm a potential bullish trend reversal.
EOS decreased considerable on Dec 4, falling to a low of $2.39. However, the low and ensuing bounce served to validate a long-term ascending support line for the third time (green icons). The line has been in place since March 2020.
SponsoredDespite the bounce, technical indicators provide a relatively neutral outlook.
The MACD, which is created by a short- and a long-term moving average (MA), is falling and is showing a reading of 0. This means that the short-term and long-term MAs are moving at the same speed, but the short-term one is decelerating. It is a sign of a weakening trend.
Similarly, the RSI is just below 50. The RSI is a momentum indicator, and readings below 50 are considered bearish.

Current range
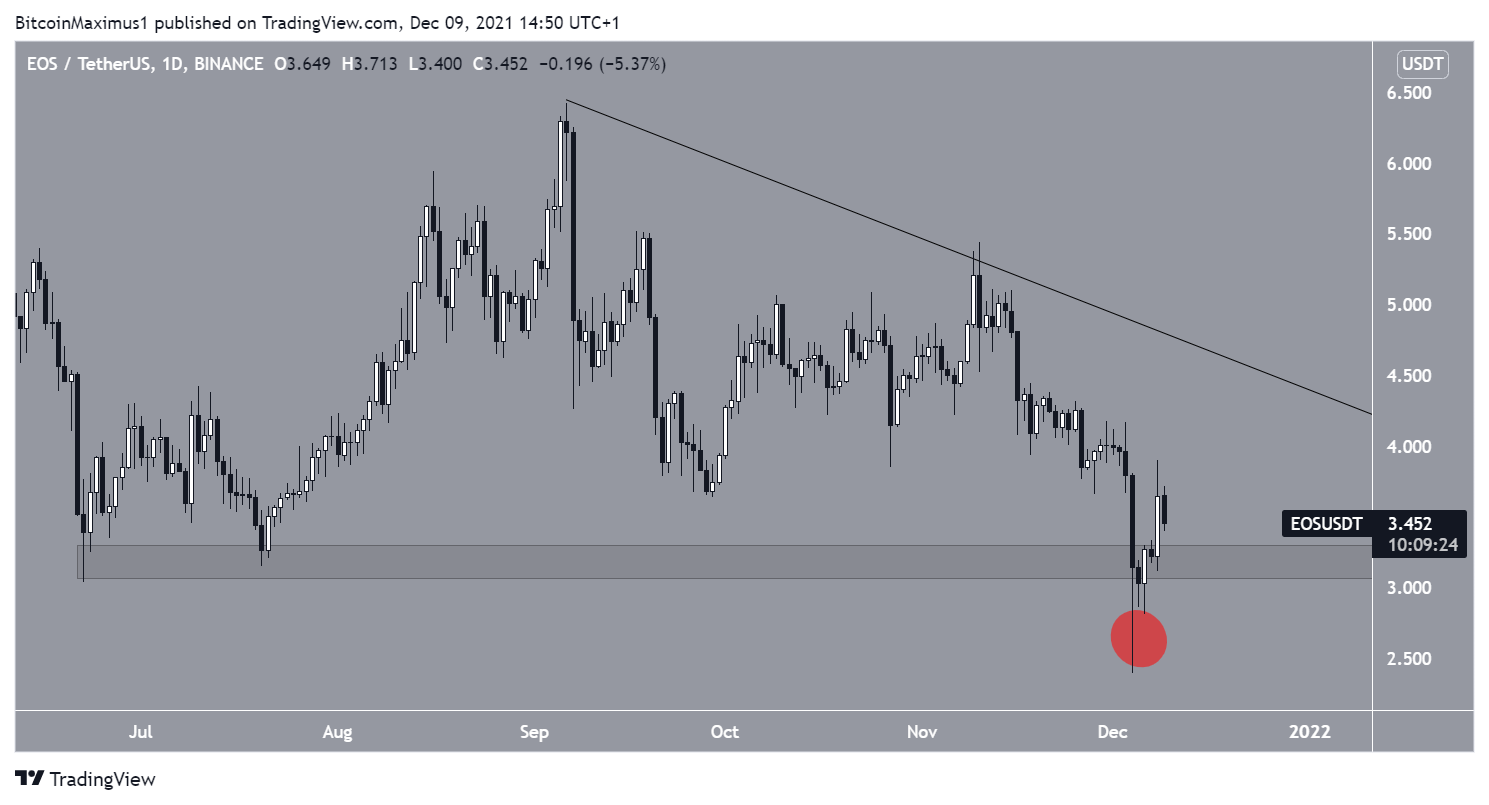
Cryptocurrency trader @Mesawine1 outlined an EOS chart which shows the token accumulating inside a range, suggesting that it will sweep the June lows.

Since the tweet, EOS has swept the June lows and bounced. While it initially seemed that it broke down below the $3.20 area, it has since reclaimed it, rendering the breakdown as a deviation only (red circle). This is a bullish development that is often followed by an upward movement.
However, the token is still following a descending resistance line. Until it breaks out, the bullish reversal cannot be confirmed.
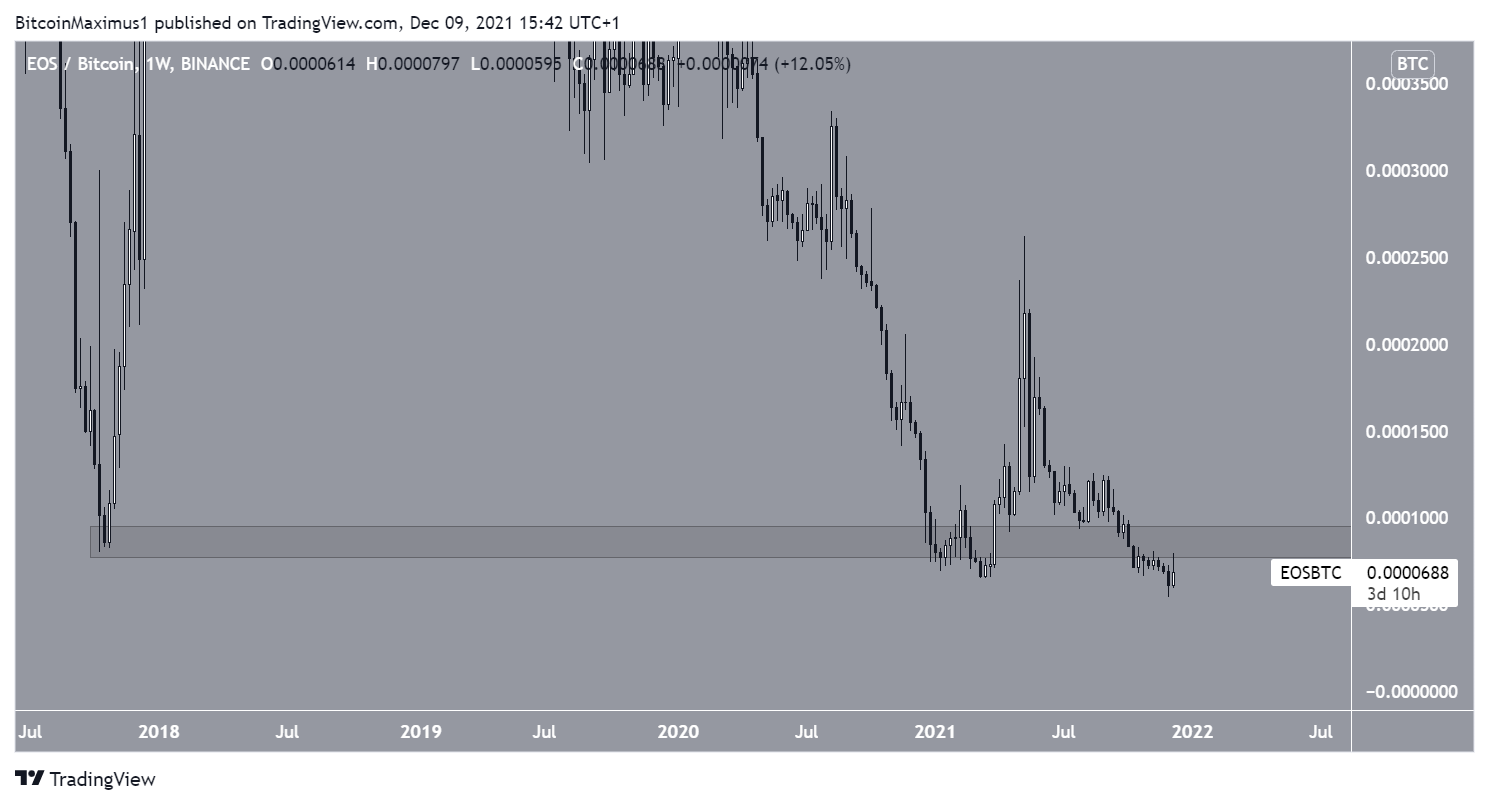
EOS/BTC
The EOS/BTC chart is decisively bearish, since the token reached a new all-time low of 5420 satoshis on Dec 4. Therefore, the token is now in bearish price discovery.
Until EOS manages to reclaim the 8000 satoshi horizontal area, the long-term trend is considered bearish.
For BeInCrypto’s latest Bitcoin (BTC) analysis, click here.
