
The Dogecoin (DOGE) price has decreased since July 25. On October 9, it broke down from a horizontal support area.
Despite the breakdown, the price did not decrease significantly. On the contrary, it began an upward movement four days later.
Will Dogecoin Reclaim Critical Level?
SponsoredThe daily timeframe technical analysis for DOGE shows that the price has traded above the $0.060 horizontal support area since June.
During this time, the DOGE price has also followed a descending resistance trendline. When combined, these create a descending triangle, considered a bearish pattern.
On October 9, the Dogecoin price broke down below the support level. However, the breakdown was short-lived since the price reversed the trend shortly afterward.
DOGE currently trades inside the $0.060 horizontal area and the descending resistance trendline. Until now, the line has been in place for 85 days.
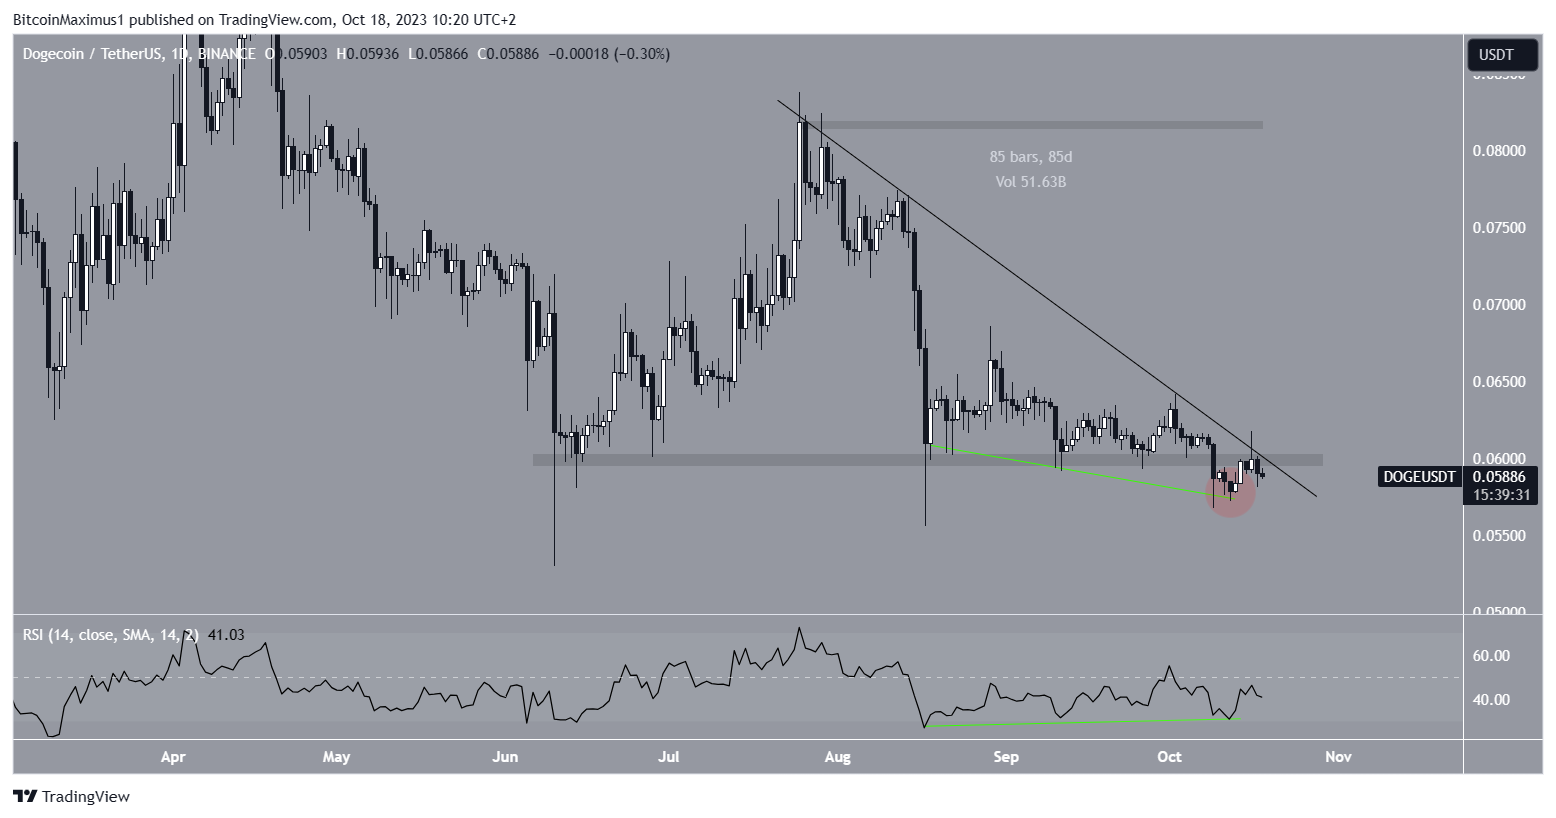
The daily Relative Strength Index (RSI) is bullish. The RSI is a momentum indicator used to assess whether a market is overbought or oversold, guiding traders on when to buy or sell assets.
Sponsored SponsoredAn RSI reading above 50 during an upward trend favors a bullish outlook. Conversely, an RSI reading below 50 suggests a bearish sentiment.
While the RSI is still below 50, it is increasing. Also, it has generated a bullish divergence since August (green).
A bullish divergence occurs when a momentum increase accompanies a price decrease and often precedes bullish trend reversals.
DOGE Price Prediction: Will Price Reclaim Resistance?
Due to the bullish RSI readings and the failed DOGE price reclaim, the daily timeframe gives an undetermined outlook.
SponsoredTwo things have to occur to confirm the trend: The meme coin has to reach a daily close above the descending resistance trendline. Secondly, the $0.060 area and the daily RSI must move above 50.
Check Out the Best Upcoming Airdrops in 2023
If this occurs, the DOGE price can increase by 20% and reach the $0.070 resistance. The resistance is created by the 0.5 Fib retracement level of the entire downward movement.
EfloudTheSurfer, a well-known cryptocurrency trader with over 130,000 followers on X, gives a similar outlook.
According to the Fibonacci retracement theory, after a significant price move in one direction, the price is expected to partially retrace to a previous level before continuing in the same direction.
Sponsored SponsoredThis theory also aids in identifying potential support levels during downturns. The 1.61 external Fib level is at $0.048, suitable for a potential bottom.
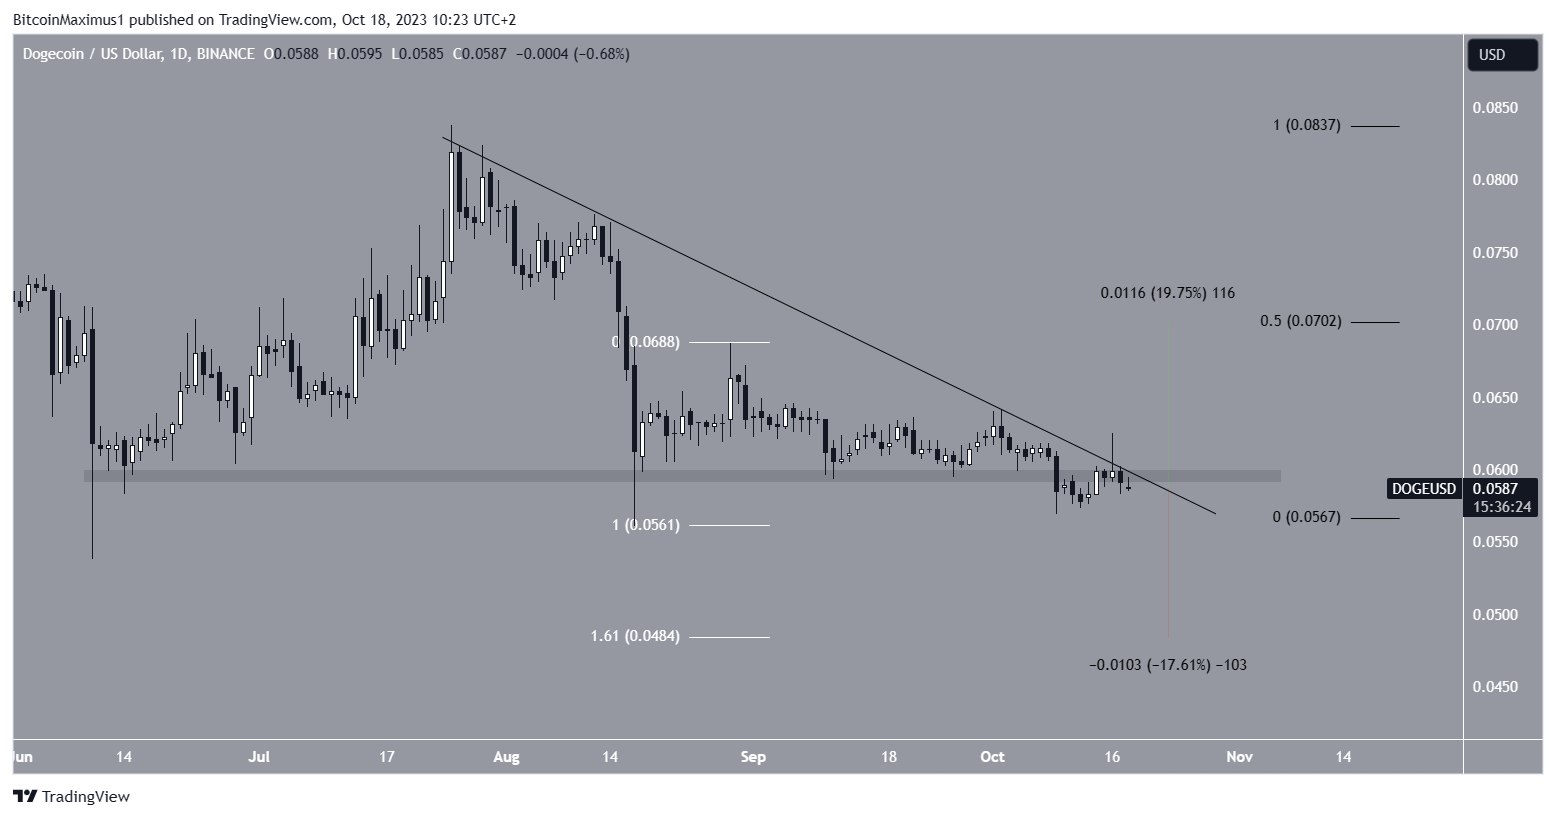
Therefore, the price prediction for DOGE will depend on whether the price breaks out above $0.060 or gets rejected.
Sponsored SponsoredIn case of a rejection, the altcoin can drop by 18% to the next support at $0.048.
