
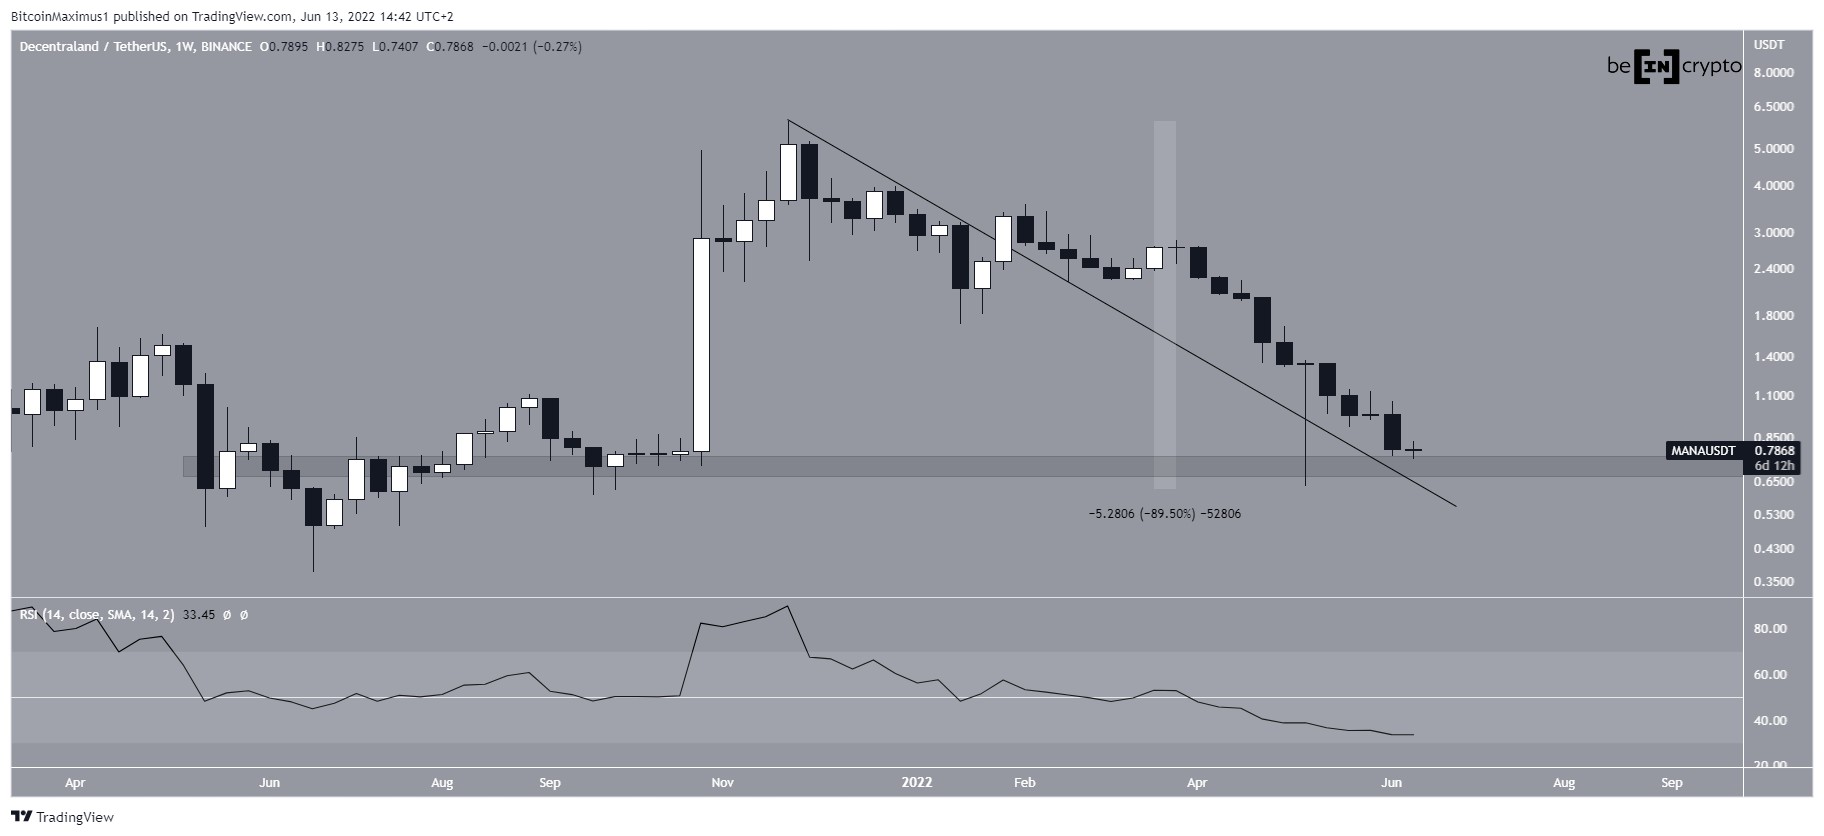
Despite the ongoing market correction, Decentraland (MANA) has not broken down below its May 12 bottom and could be in the process of creating a higher low.
MANA has been falling since reaching an all-time high price of $5.90 on Nov. 25, 2021. The downward movement has so far led to a low of $0.63 on May 12. This amounted to a drop of 89% measuring from the all-time high.
SponsoredThe low was made inside the $0.72 horizontal area, which previously acted as support throughout April – May 2021.
The weekly RSI is below 50 and falling, readings which are considered bearish.
Short-term bounce
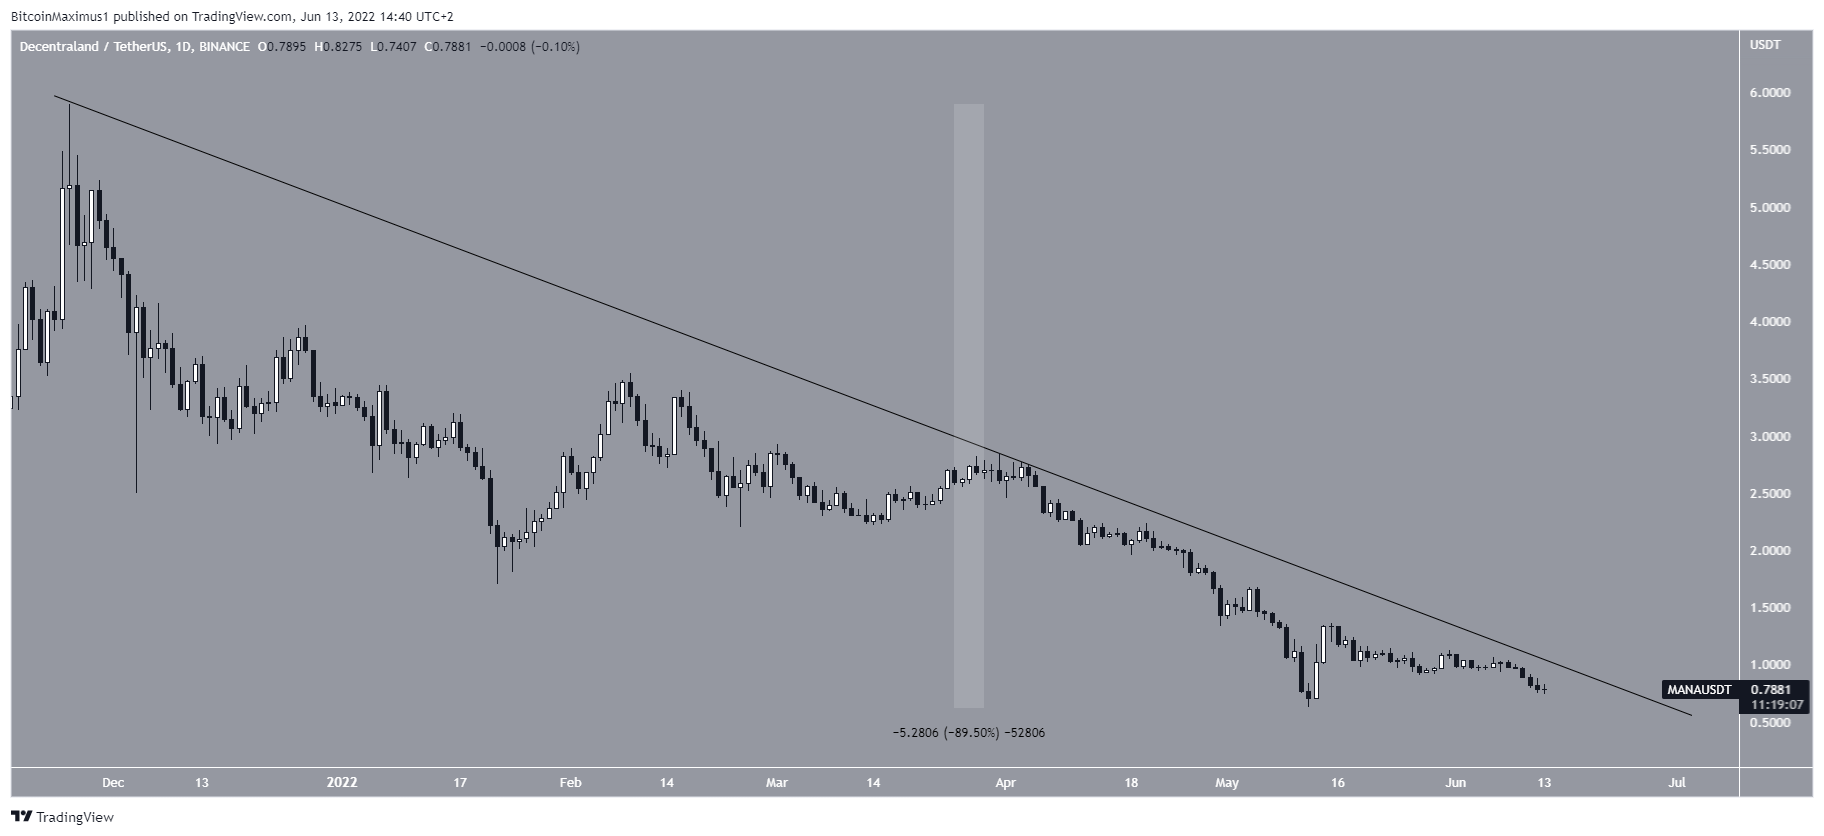
The daily chart shows that after the May 12 low, the price bounced sharply for two days, but has been falling since. Despite this reversal, it has yet to break down below its May 12 lows. So, the price could still create a higher low.
SponsoredMANA has also been following a descending resistance line since the all-time high. Currently, the line is at $0.80. A breakout from it would be required in order for the trend to be considered bullish.
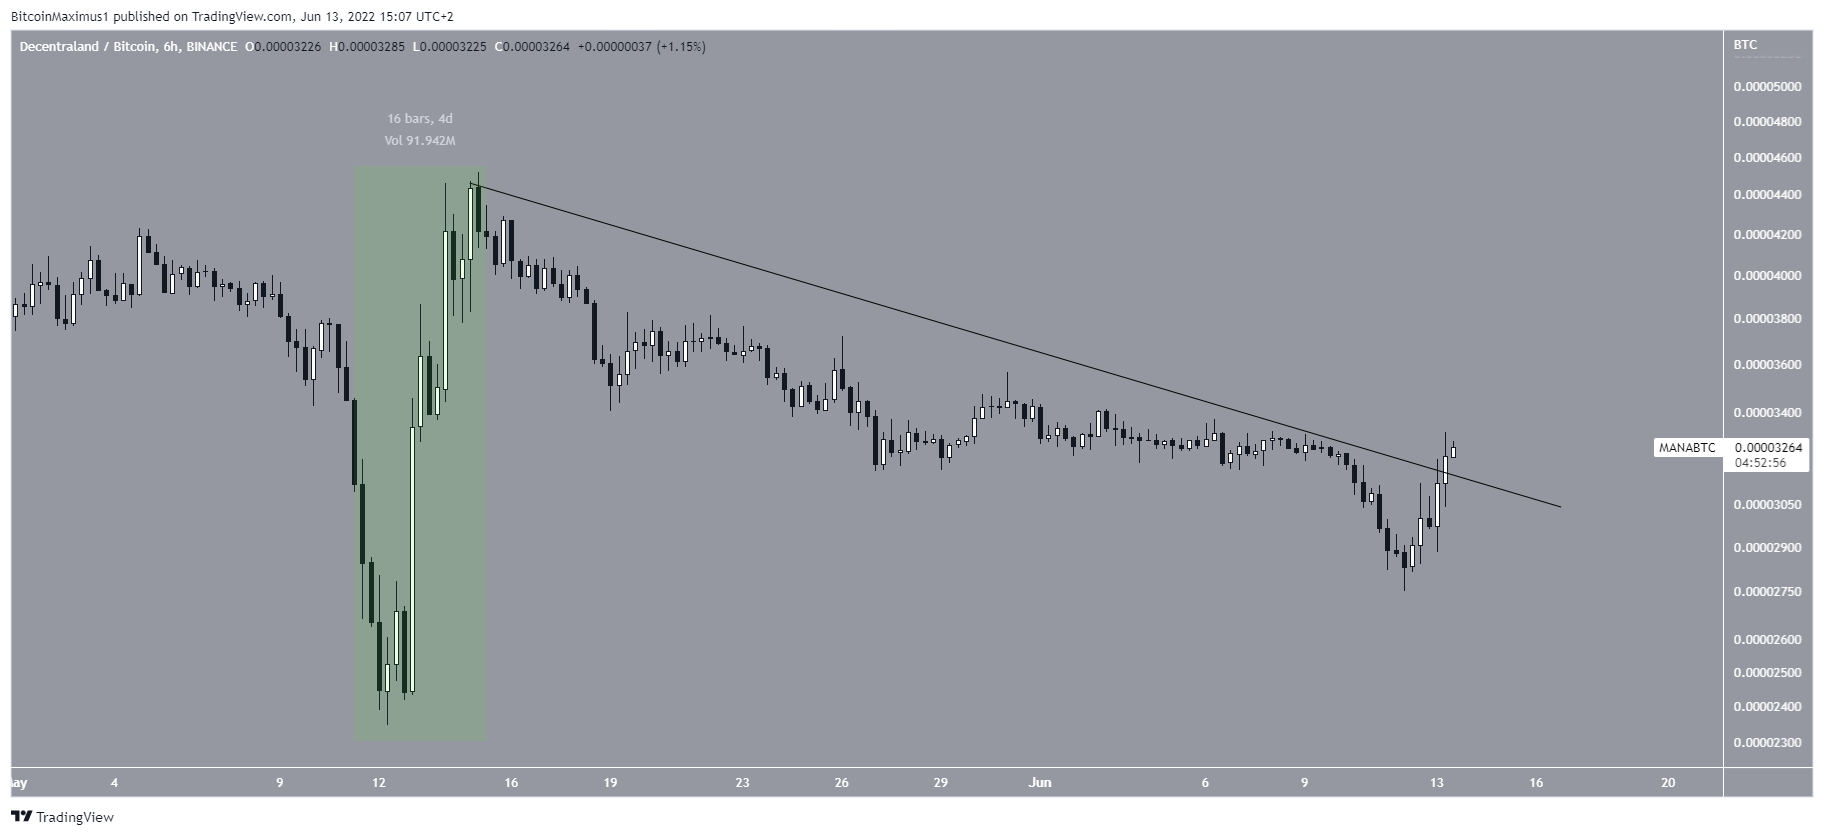
The six-hour chart shows that MANA has been trading inside a descending parallel channel since May 14.
This can be seen as a bullish sign since such channels usually contain corrections.
Therefore, if the price manages to bounce at the support line of the channel and reclaim the midline, a breakout would be expected.
SponsoredThis would also cause a breakout from the long-term resistance line, hence ending the correction.

MANA/BTC
Cryptocurrency investor @hayess5178 tweeted a chart of MANA, stating that the price always bounces when BTC stops falling.
Sponsored
The MANA/BTC pair shows a similar reading to the short-term MANA/USD pair. However, instead of trading in a channel, the price has already broken out from a descending resistance line.
SponsoredFurthermore, the movement since May 12 (green area) looks impulsive. So, it is possible that the price initiated a bullish reversal on May 12 and has now completed its retracement.
For Be[in]Crypto’s latest bitcoin (BTC) analysis, click here
