
In January 2018, the price of Cardano (ADA) reached a high of $1.35. It has been decreasing since.
In August of the same year, it reached lows close to $0.095.
This was the same price level as before the beginning of the upward move in November 2017.
Sponsored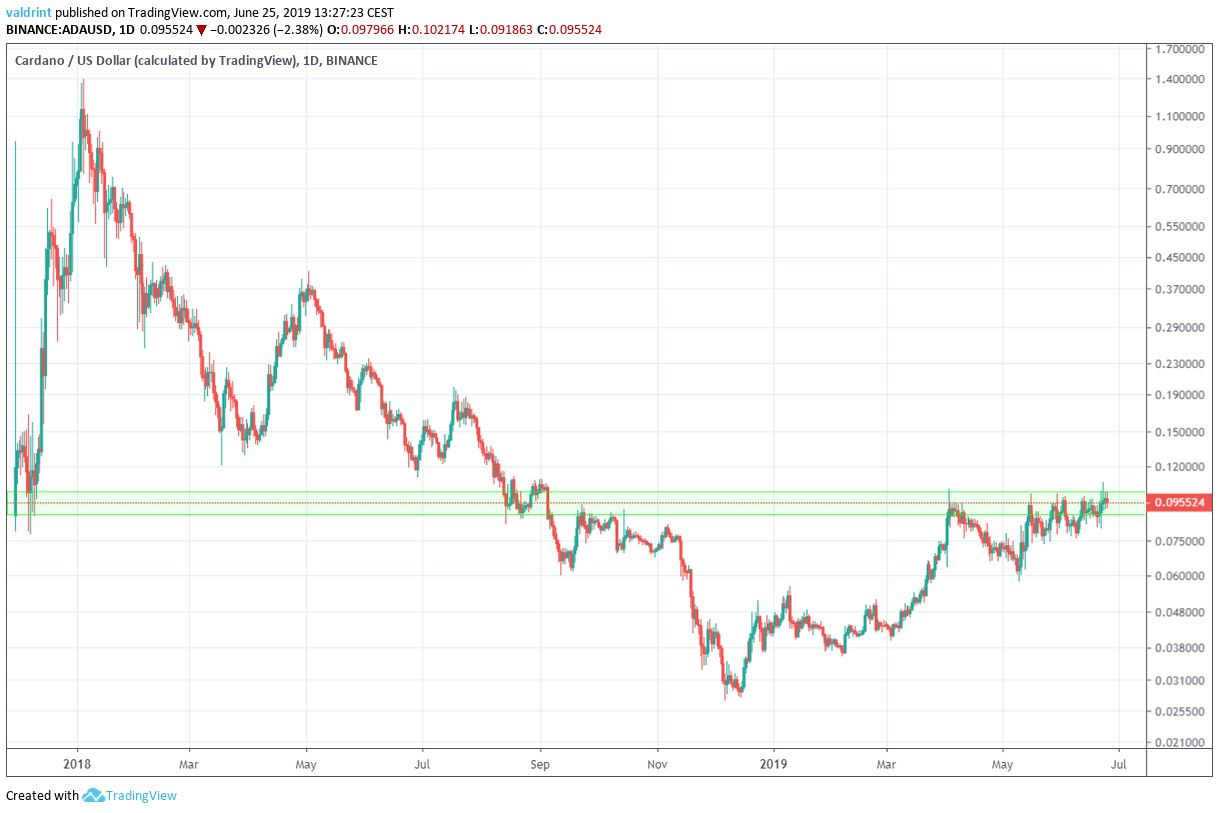
The Cardano price continued to decrease and in December 2018 it reached a low of $0.03. Since then, it has been increasing and has reached the previous support area at $0.095. It is likely that this area will now act as resistance.
Will it break out? Let’s find out.
For a video analysis please click below
Cardano Price: Trends And Highlights For June 25
- There is a long-term bearish divergence developing in the RSI.
- The ADA price is trading inside an ascending channel.
- There is significant resistance near $0.095.
- There is a short-term bearish divergence developing in the RSI.
ADA Price Divergence
Sponsored Sponsored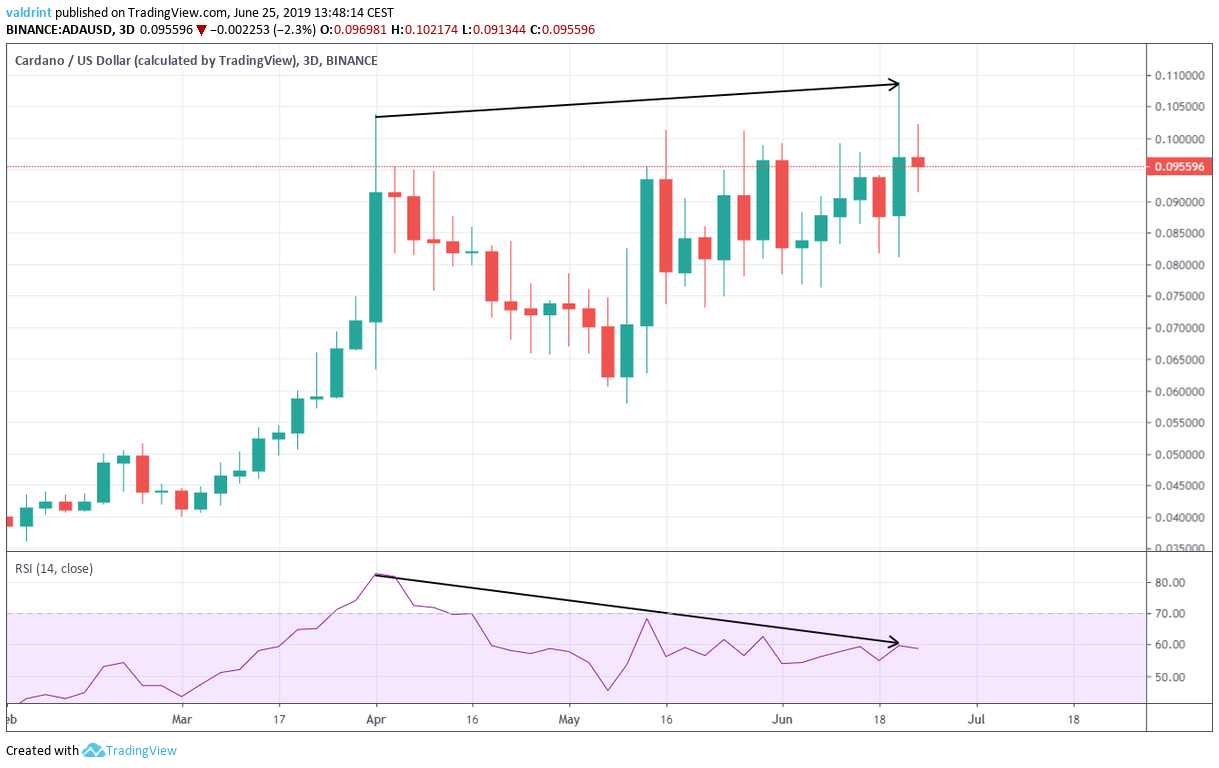
This occurrence is known as bearish divergence and often precedes price decreases. Furthermore, it is occurring in a three-day time-frame, which is considered a relatively long-term timeframe.
Another bearish characteristic is the fact that the price has not made a close at or above $0.1. The candlesticks that have reached values close to $0.1 have been characterized by long upper wicks, indicating that there is selling pressure on the market.
The long-term RSI makes it unlikely that the price will break out. Let’s take a closer look at a shorter time-frame.
Ascending Channel
SponsoredThe ADA price has been trading inside an ascending channel since May 13. At the time of writing, it was trading close to the resistance line of the channel.
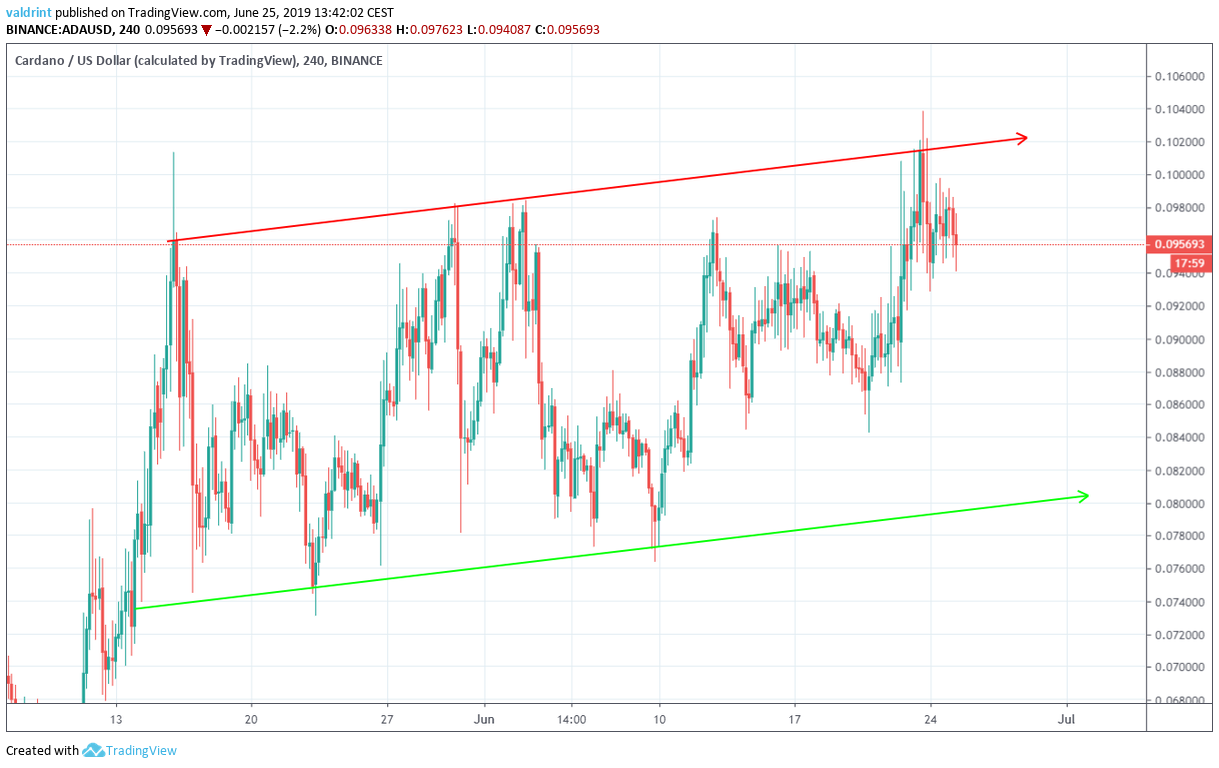
Since touching the line on June 23, the price has been decreasing.
Furthermore, the most recent high was combined with a bearish divergence in the RSI.
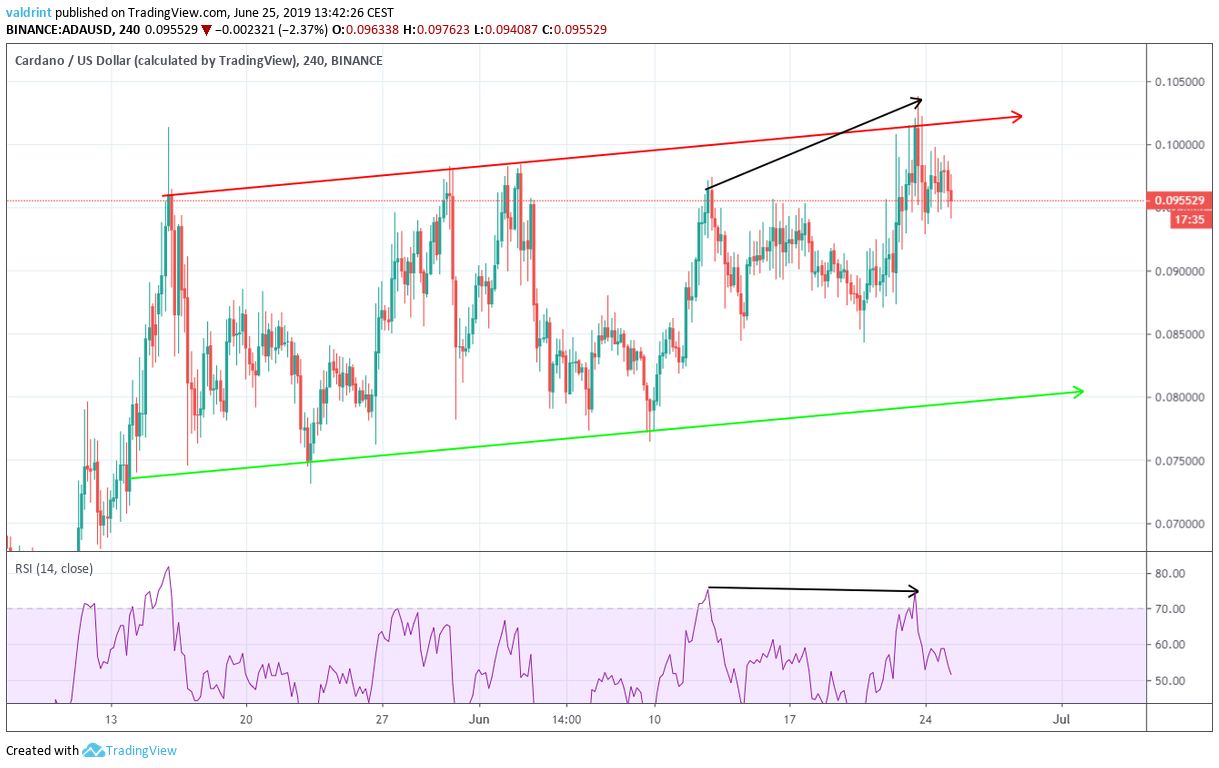
As a result, ADA has created both long- and short-term bearish divergence near significant resistance areas. It has done so in the $0.095 resistance area in the long-term and in the resistance line of the ascending channel in the short-term.
Sponsored SponsoredThe use of these indicators combined with previous market movement makes it likely that the ADA price will decrease towards the support line of the channel.
Summary
The price of Cardano has been on an uptrend since the beginning of 2019. However, it recently reached a major resistance area and has not yet broken through.
Sponsored SponsoredTechnical indicators and candlestick characteristics give a bearish outlook and support a price reversal.
Do you think the ADA price will begin to decrease? Let us know in the comments below.
Disclaimer: This article is not trading advice and should not be construed as such. Always consult a trained financial professional before investing in cryptocurrencies, as the market is particularly volatile.
Images are courtesy of TradingView.
