
After six unsuccessful attempts, the Cardano (ADA) price reached a weekly close above a long-term resistance area last week.
This was the highest weekly close since May 2021. Will it mark the beginning of Cardano’s long-term bullish cycle? Let’s find out!
SponsoredCardano Closes Above Long-Term Resistance
The weekly time frame analysis shows the ADA price has increased since September 2023. The upward movement culminated with a high of $0.68 in December, a new yearly high.
ADA did not close above the $0.58 horizontal resistance area despite the increase. Rather, it created six consecutive long upper wicks (red icons) and fell below the area. These wicks are considered signs of selling pressure. However, the ADA price increased and reached a weekly close above this area last week. This was the highest ADA weekly close since May 2022.
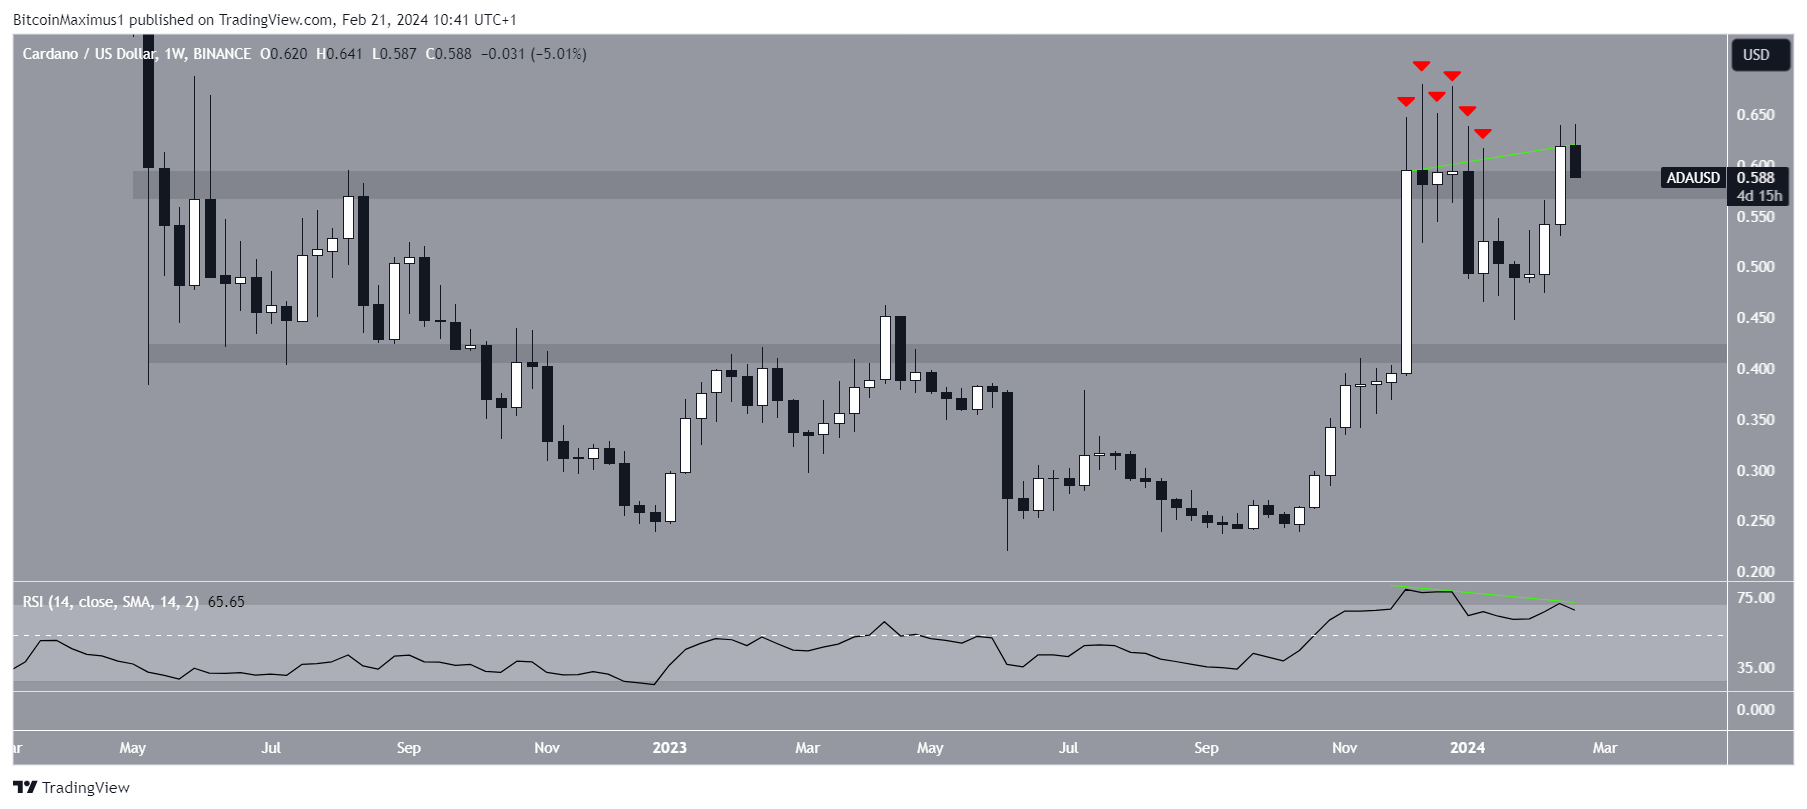
Despite the positive weekly close, the weekly Relative Strength Index (RSI) is bearish. The RSI is a momentum indicator traders use to evaluate whether a market is overbought or oversold and whether to accumulate or sell an asset.
Read More: How To Stake Cardano (ADA)
Readings above 50 and an upward trend suggest that bulls still have an advantage, while readings below 50 indicate the opposite. The indicator has generated bearish divergence (green line), often preceding downward movements.
ADA Price Prediction: Has the Trend Turned Bullish?
The daily time frame chart is bullish because of the price action, wave count, and RSI readings. The price action shows that ADA broke out from a descending resistance trend line and reclaimed the $0.58 resistance area. This ADA price increase was accompanied by an RSI movement above 50, legitimizing it.
Zach Humphries said he has patiently stacked ADA for several years and is now ready for the breakthrough. In a poll made by WhaleFUD, 48% of respondents believe ADA will flip Ethereum by market capitalization. It is also worth mentioning that Cardano’s founder, Charles Hoskinson, made a surprise AMA two days ago.
SponsoredThe wave count also aligns with this ongoing upward movement. Technical analysts utilize the Elliott Wave theory to ascertain the trend’s direction by studying recurring long-term price patterns and investor psychology. The most likely count suggests the ADA price is in the fifth and final wave of its upward movement. A potential target for the top of the increase is $0.83, 40% above the current price.
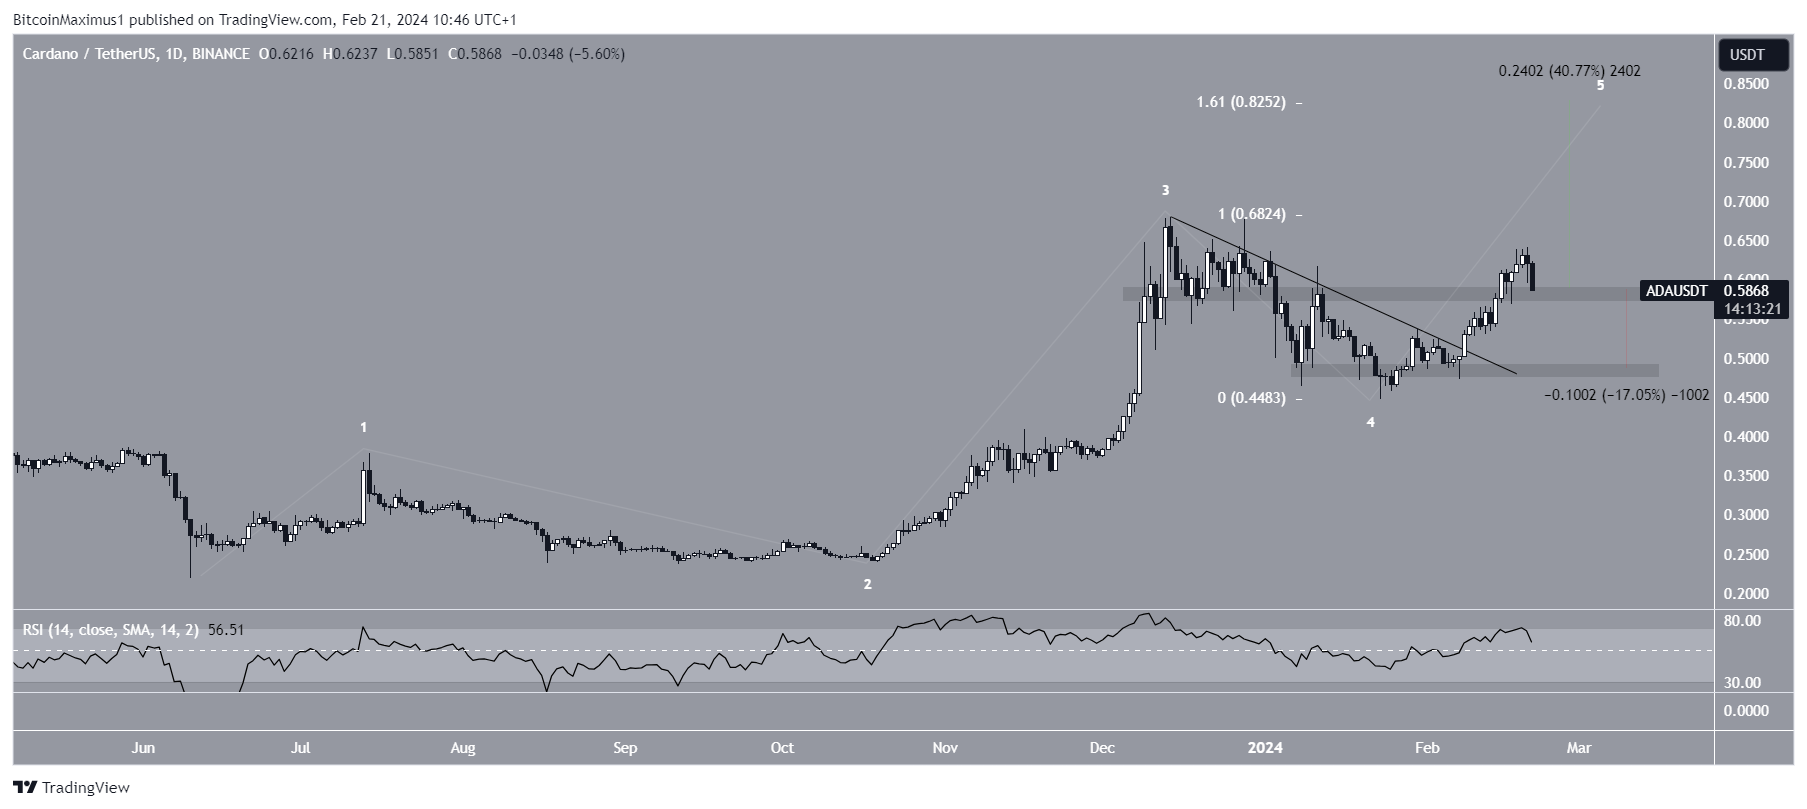
Despite this bullish ADA price prediction, a close below $0.58 could trigger a 17% drop to the closest support at $0.50.
For BeInCrypto‘s latest crypto market analysis, click here.
