
The Cardano (ADA) price has fallen since December 14, 2023, creating a lower high on December 29.
Cardano recently fell below an important horizontal support area and is validating it as resistance.
Cardano Falls After Multiple Rejections
SponsoredThe technical analysis of the weekly time frame shows that the ADA price has increased swiftly since October 2023. However, despite numerous attempts, it failed to break out from a critical horizontal resistance area in place since May 2022.
ADA created six consecutive long upper wicks (red icons), considered signs of selling pressure. A sharp downward movement followed in January 2024.
The ADA price is now approaching the previous breakout level.
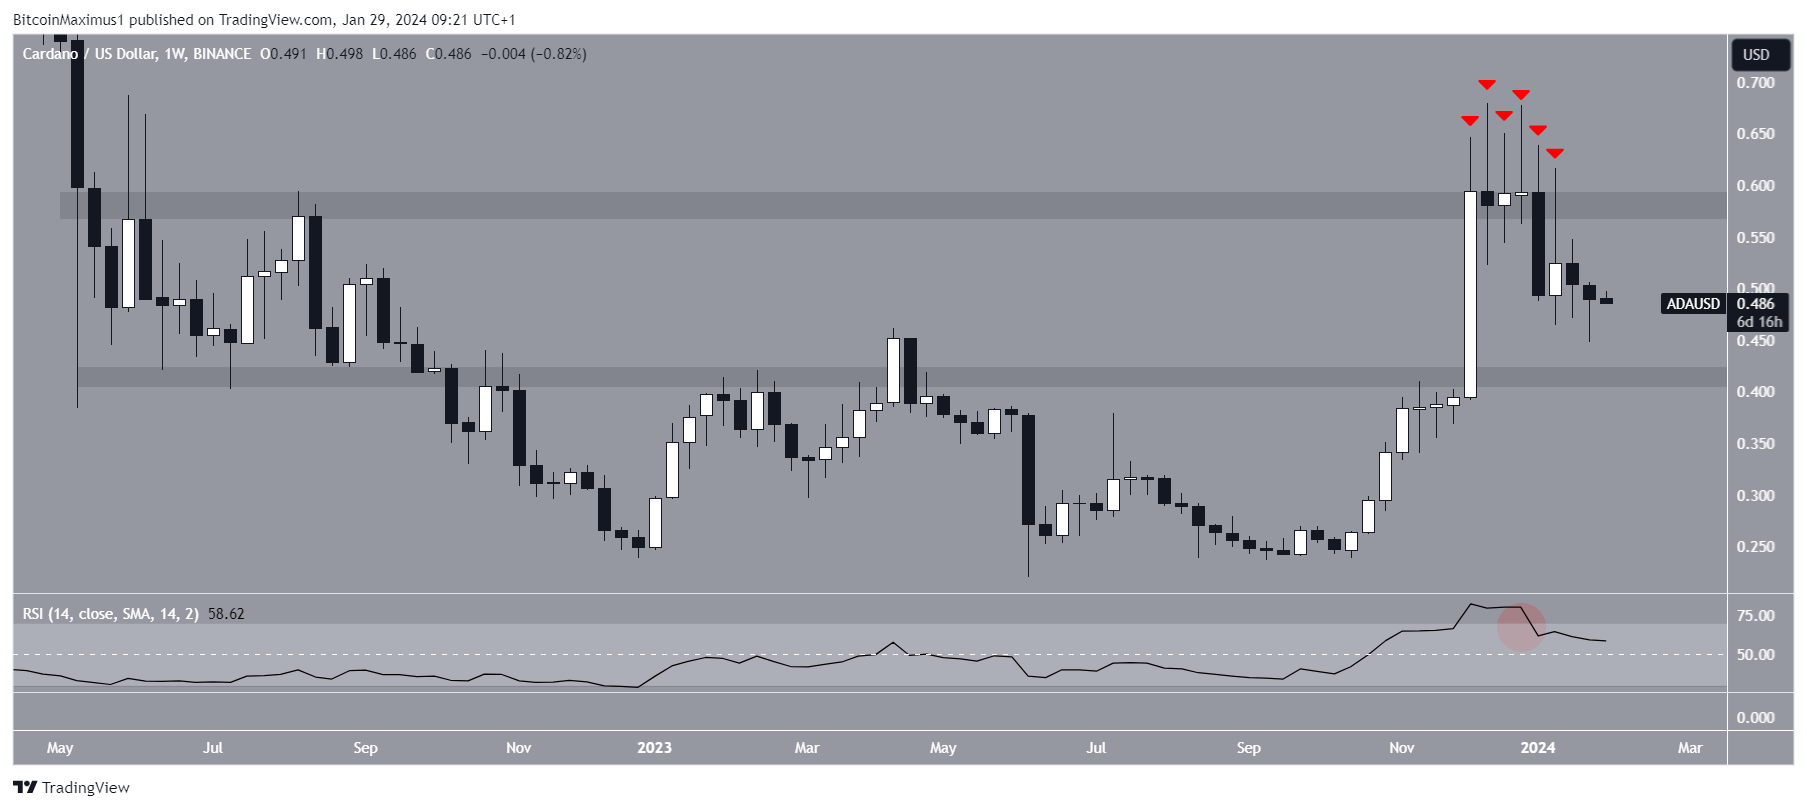
The weekly Relative Strength Index (RSI) gives a bearish reading. Traders utilize the RSI as a momentum indicator to assess whether a market is overbought or oversold and whether to accumulate or sell an asset.
SponsoredIf the RSI reading is above 50 and the trend is upward, bulls still have an advantage, but if the reading is below 50, the opposite is true. The indicator fell below 70 (red circle) and is decreasing, both signs of a bearish trend.
Read More: How To Stake Cardano (ADA)
ADA Price Prediction: $0.50 or $0.40 Next?
The daily time frame technical analysis projects a bearish ADA trend because of the price action, RSI, and wave count.
Elliott Wave theory involves the analysis of recurring long-term price patterns and investor psychology to determine the direction of a trend.
SponsoredThe most likely count suggests that ADA is in wave C of an A-B-C corrective structure. Giving waves A:C a 1:1 ratio leads to a low of $0.41, aligning with the 0.618 Fib retracement support level (white).
The price action shows that ADA validates the $0.50 area as resistance after breaking down. This is a common retest after such breakdowns.
Finally, the daily RSI is below 50 and falling, both signs of a bearish trend.
SponsoredIf the downward movement continues, ADA can fall 16% to the 0.618 Fib retracement support level at $0.41.
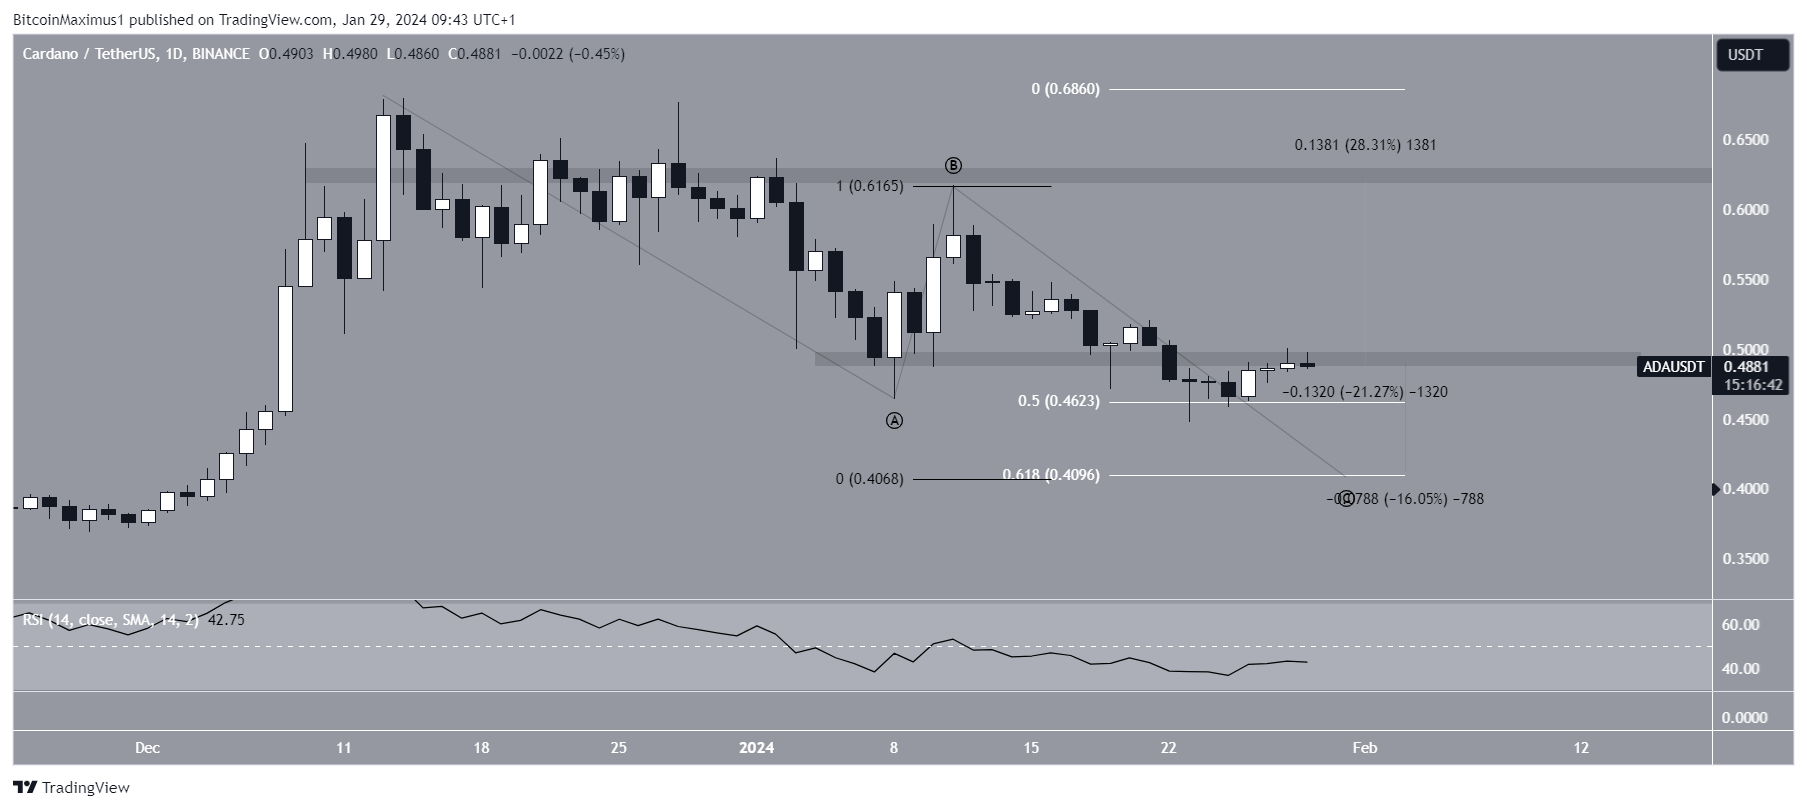
Despite this bearish ADA trend prediction, reclaiming $0.50 can trigger a nearly 30% increase to the next resistance at $0.63.
For BeInCrypto‘s latest crypto market analysis, click here.
