
Solana (SOL) is following a parabolic ascending support line and reached an all-time high price on Sept 9.
Serum (SRM) reached a new all-time high on Sept 11. While it has been decreasing since, it recently bounced at the $10 support area.
Chainlink (LINK) is trading above the $24.80 support area where it bounced on Sept 9.
SOL
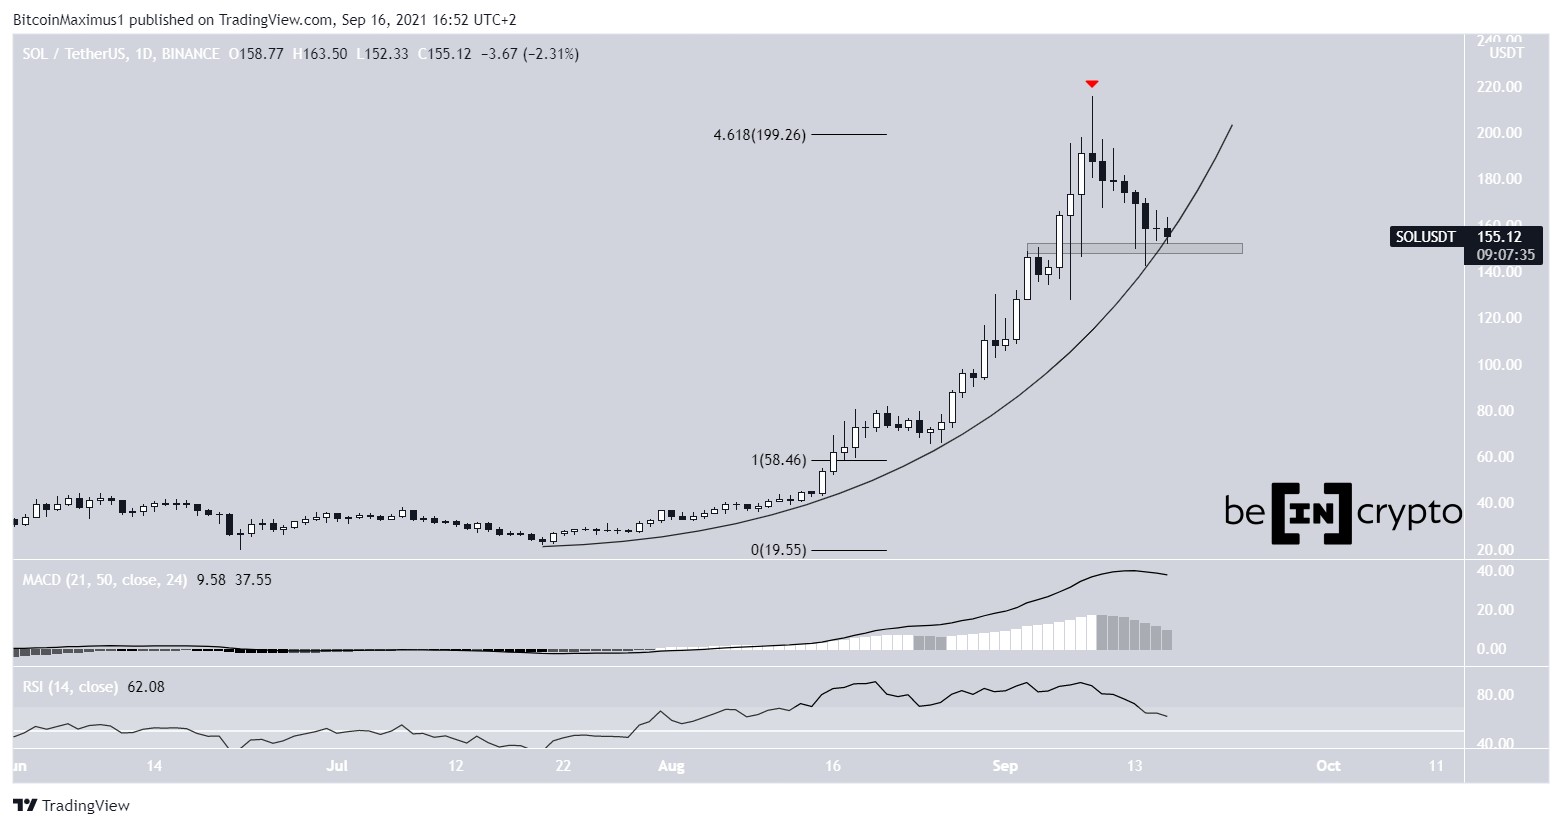
SOL has been increasing alongside a parabolic ascending support line since July 20. The rate of increase accelerated on Aug 26, after the token validated the previous all-time high resistance as support.
SponsoredThe upward movement eventually led to a $216 all-time high, which was reached on Sept 9. The high was made right at the 4.618 external Fib retracement level, which very often acts as the top of upward movements.
However, the token created a shooting star candlestick (red icon) and has been moving downwards since.
Currently, it is trading just above the $150 support area, which also coincides with the parabolic ascending support line.
Technical indicators are gradually turning bearish. The RSI and MACD are both decreasing, and the former has crossed below 70.
A breakdown from the support line could trigger a very sharp fall.
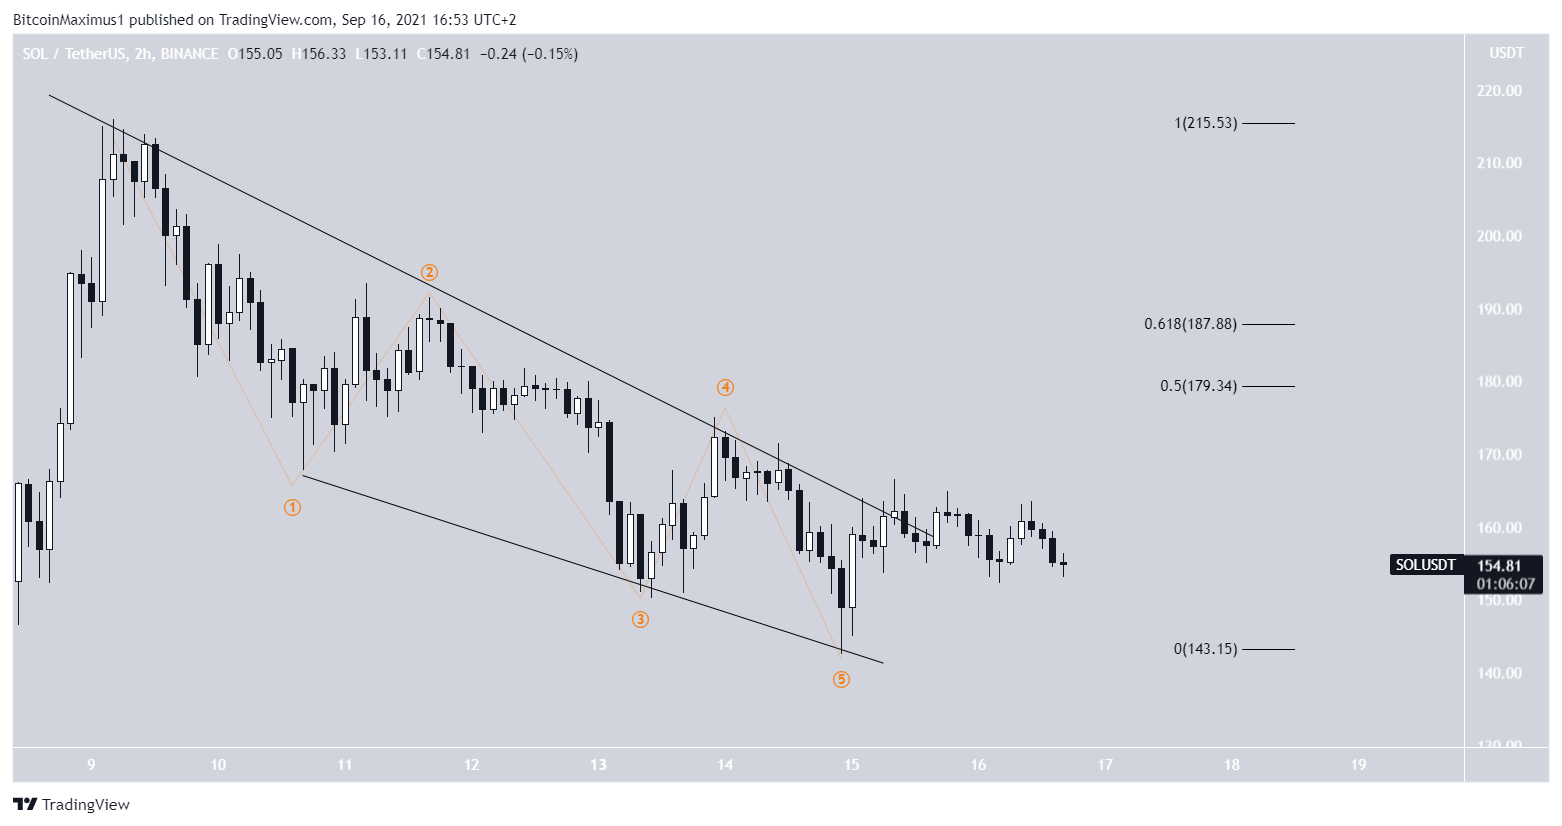
The shorter-term two-hour chart shows that the decrease is a five wave structure, which has the shape of a descending wedge. Therefore, it is possible that it is a leading diagonal.
In this case, SOL would initially bounce towards the 0.5-0.618 Fib retracement resistance levels before falling once more.
Highlights
- SOL is following a parabolic ascending support line.
- It reached an all-time high price on Sept 9.
SRM
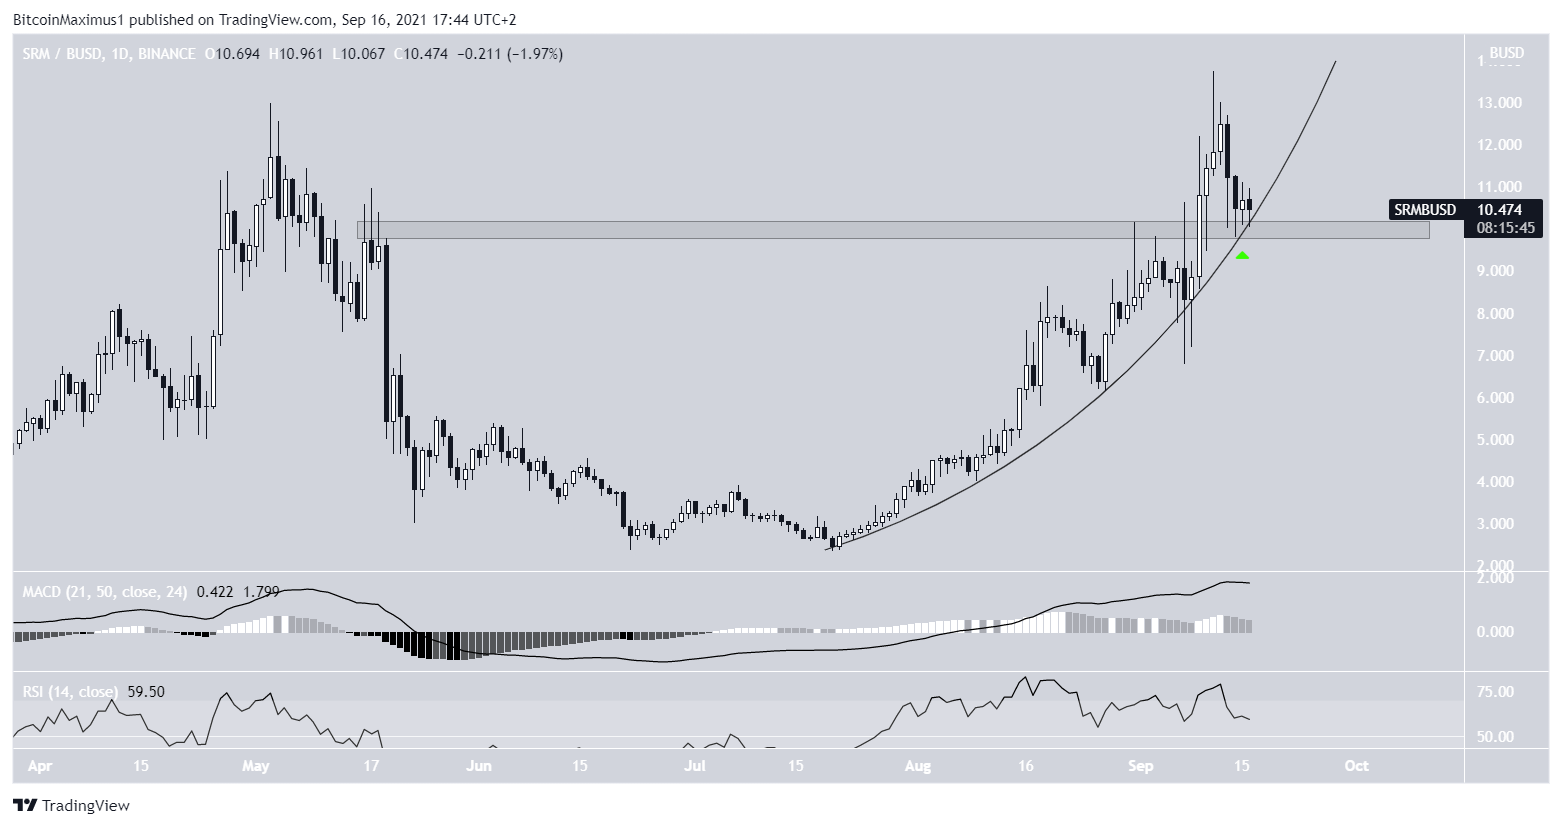
Similarly to SOL, SRM has been increasing alongside a parabolic ascending support line since July 20. On Sept 9, it broke out above the $10 resistance area and reached a new all-time high of $13.72 two days later.
While it has been moving downwards since, it has validated the $10 area as support. At the same time, it touched the parabolic ascending support line once more (green icon)
Technical indicators are bullish, but they are not showing strength. The MACD is positive but it has a neutral slope. Similarly, the RSI is above 50, but is decreasing slightly.
Nevertheless, the trend can be considered bullish as long as the token is trading above the $10 area and the parabolic support line.
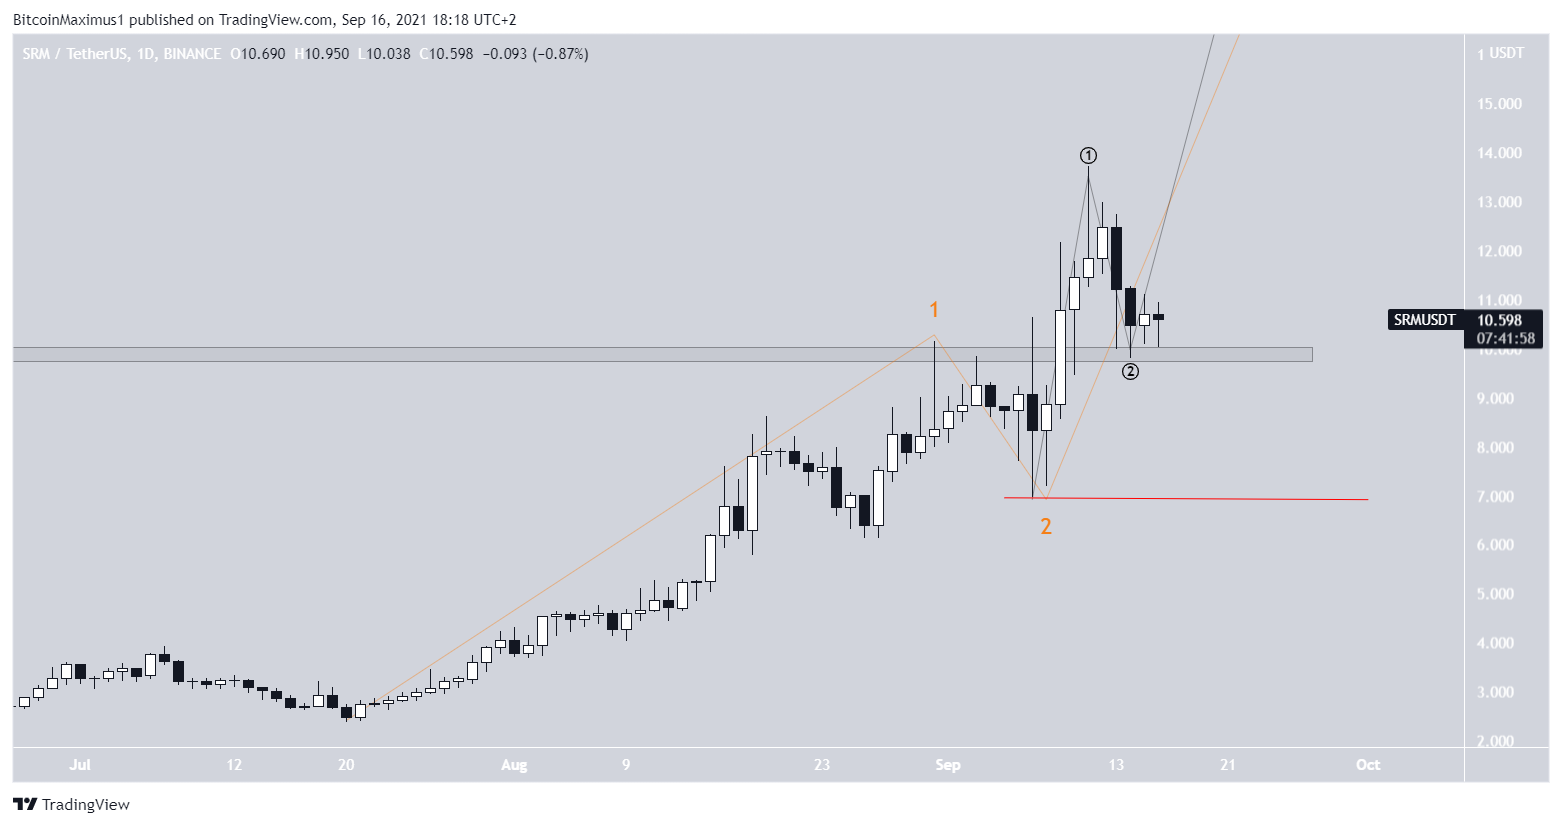
While not yet confirmed, it is possible that the movement since July 20 is a massive 1-2/1-2 wave formation.
If correct, it could take SRM well into a new all-time high and potentially towards $30.
A decrease below the wave two low of $7.21 (red line) would invalidate this possibility. Even a close below the previously outlined parabolic ascending support line would make it much less likely.
SponsoredTherefore, there is a chance that SRM could initiate a considerable upward movement, similar to that of SOL.
Highlights
- SRM is following a parabolic ascending support line.
- It is trading above support at $10.
LINK
LINK has been moving upwards since July 20. On Sept 6, it reached a high of $36.31 but fell sharply afterwards.
The next day, it validated the $24.80 area as support and created a long lower wick (green icon). The area is the 0.5 Fib retracement support level and a horizontal support area.
Technical indicators are relatively neutral. The MACD is decreasing at a very neutral slope and the RSI is right at the 50 line.
If a breakdown were to occur, the next support area would be at $22.10, the 0.618 Fib retracement support level.
Sponsored Sponsored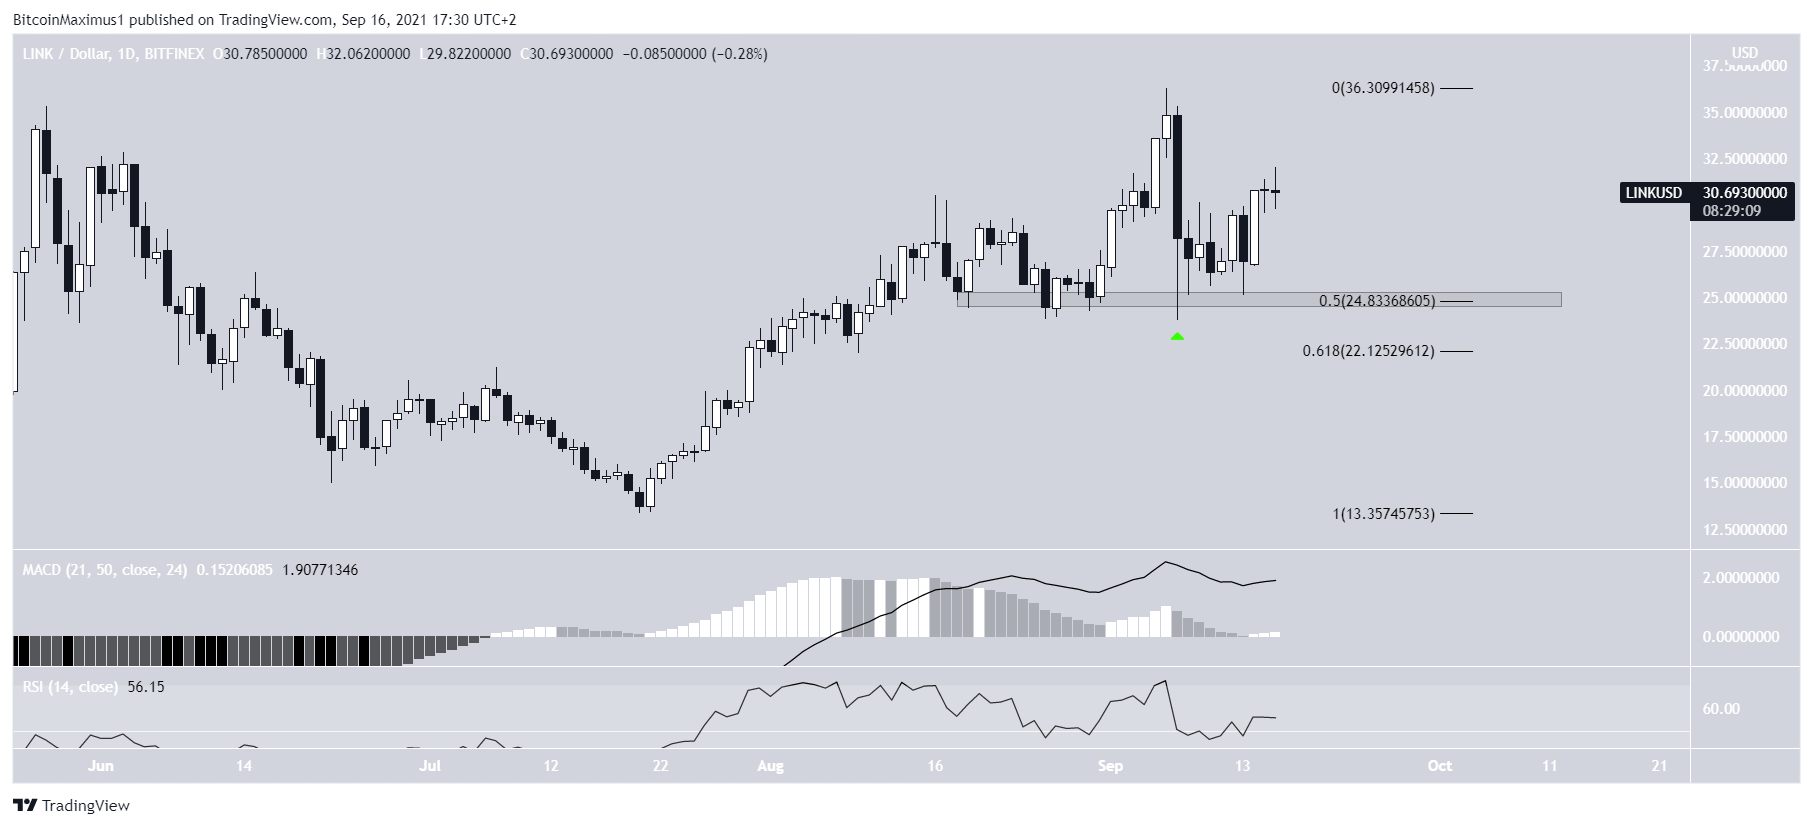
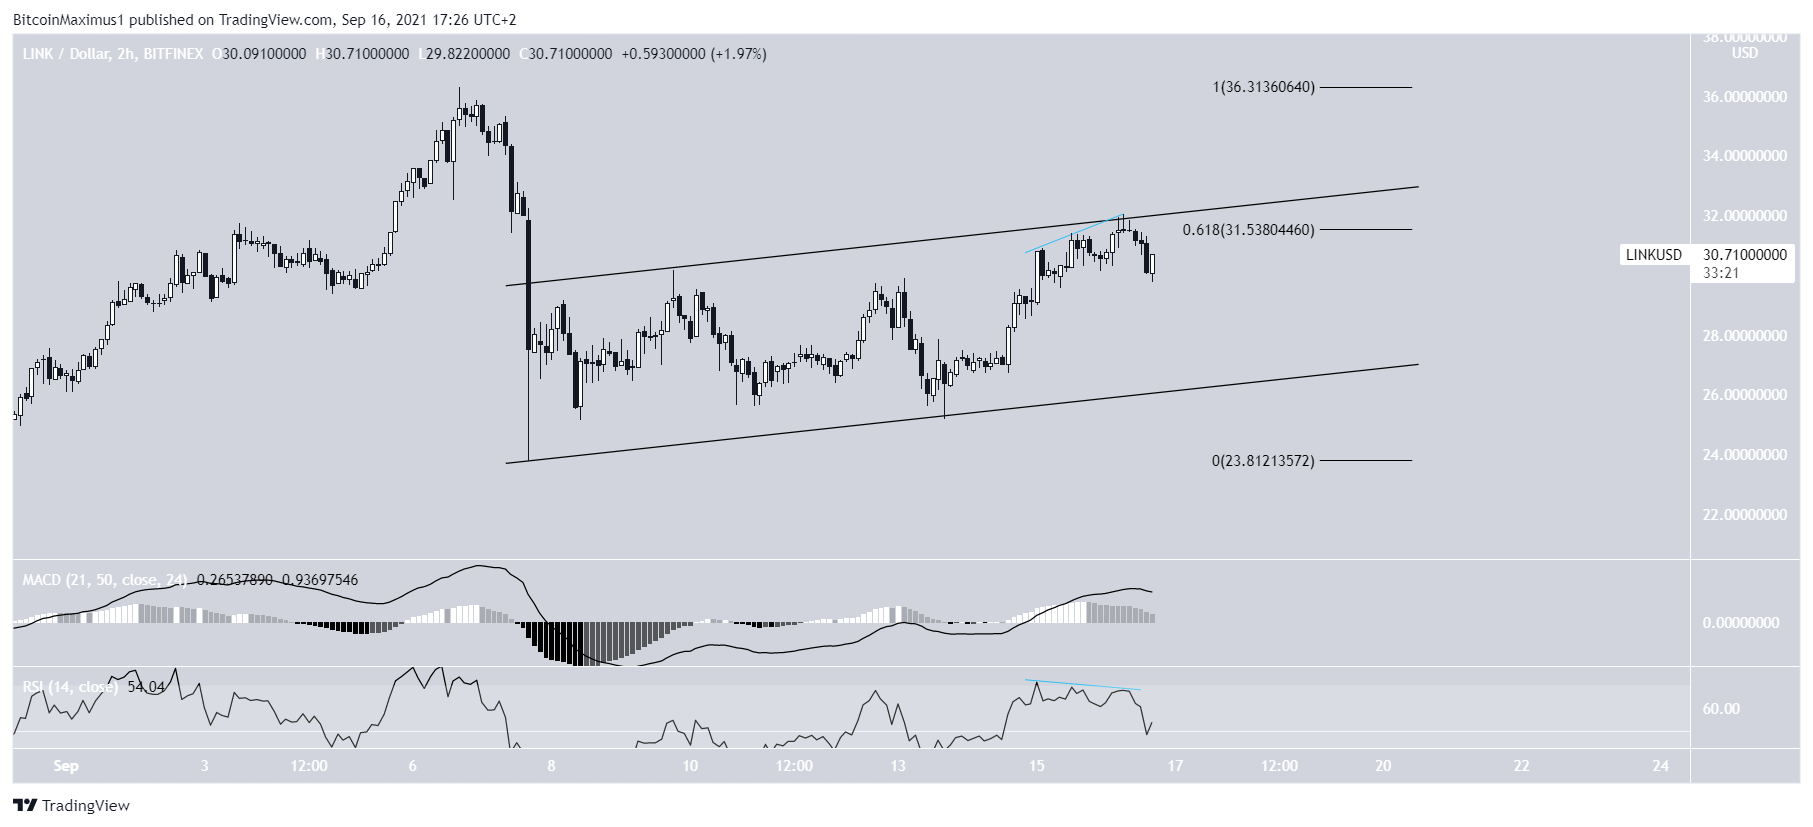
The shorter-term two-hour chart is leaning on a potential breakdown.
LINK has been trading inside an ascending parallel channel since the bounce on Sept 7. Such channels usually contain corrective structures.
It is currently trading close to the resistance line of the channel, which also coincides with the 0.618 Fib retracement resistance level.
Sponsored SponsoredFurthermore, there is a bearish divergence developing in both the RSI and MACD.
Therefore, unless LINK manages to close above the resistance line of the channel, a breakdown seems like the most likely scenario.
Highlights
- LINK is trading above the $24.80 horizontal support area.
- It is trading inside a short-term ascending parallel channel.
For BeInCrypto’s latest Bitcoin (BTC) analysis, click here.
