
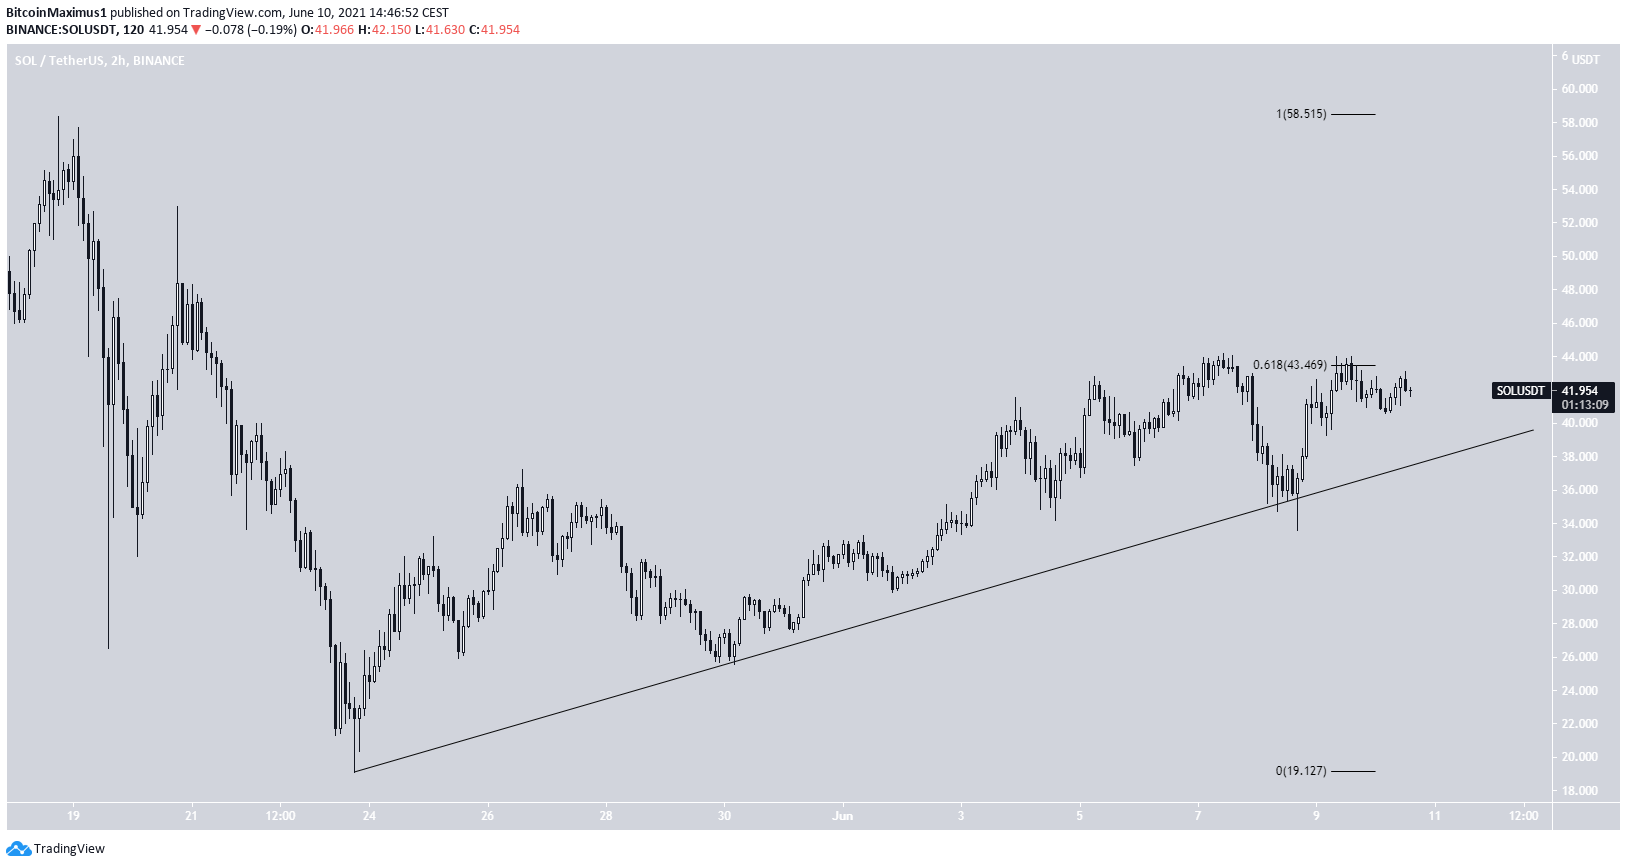
Solana (SOL) is following an ascending support line and attempting to break out above the $43.4 resistance area.
Serum (SRM) has bounced at the $3.50 support area but has yet to break out from a descending resistance line.
The Graph (GRT) is trading inside the lower portion of a descending parallel channel.
SOL
SponsoredSOL has been moving upwards since May 23, when a low of $19.10 was reached. The ensuing bounce has been significant, causing a reclaim of the $23 area in the process.
Afterwards, SOL managed to reach a high of $44 before falling and validating the $36.3 area as minor support (green icon). The $43.4 area acts as resistance, being the 0.618 Fib retracement resistance level.
Technical indicators are bullish. The MACD is almost positive, the RSI is above 50 and the Stochastic oscillator has just made a bullish cross.
Therefore, an eventual breakout is expected. If one occurs, it would be expected to take SOL towards the all-time high price of $58.39.

The shorter-term two-hour chart shows that the token is following an ascending support line. As long as it is doing so, the short-term trend remains bullish.
Highlights
Sponsored Sponsored- SOL is following an ascending support line.
- There is support and resistance at $36.3 and $43.4.
SRM
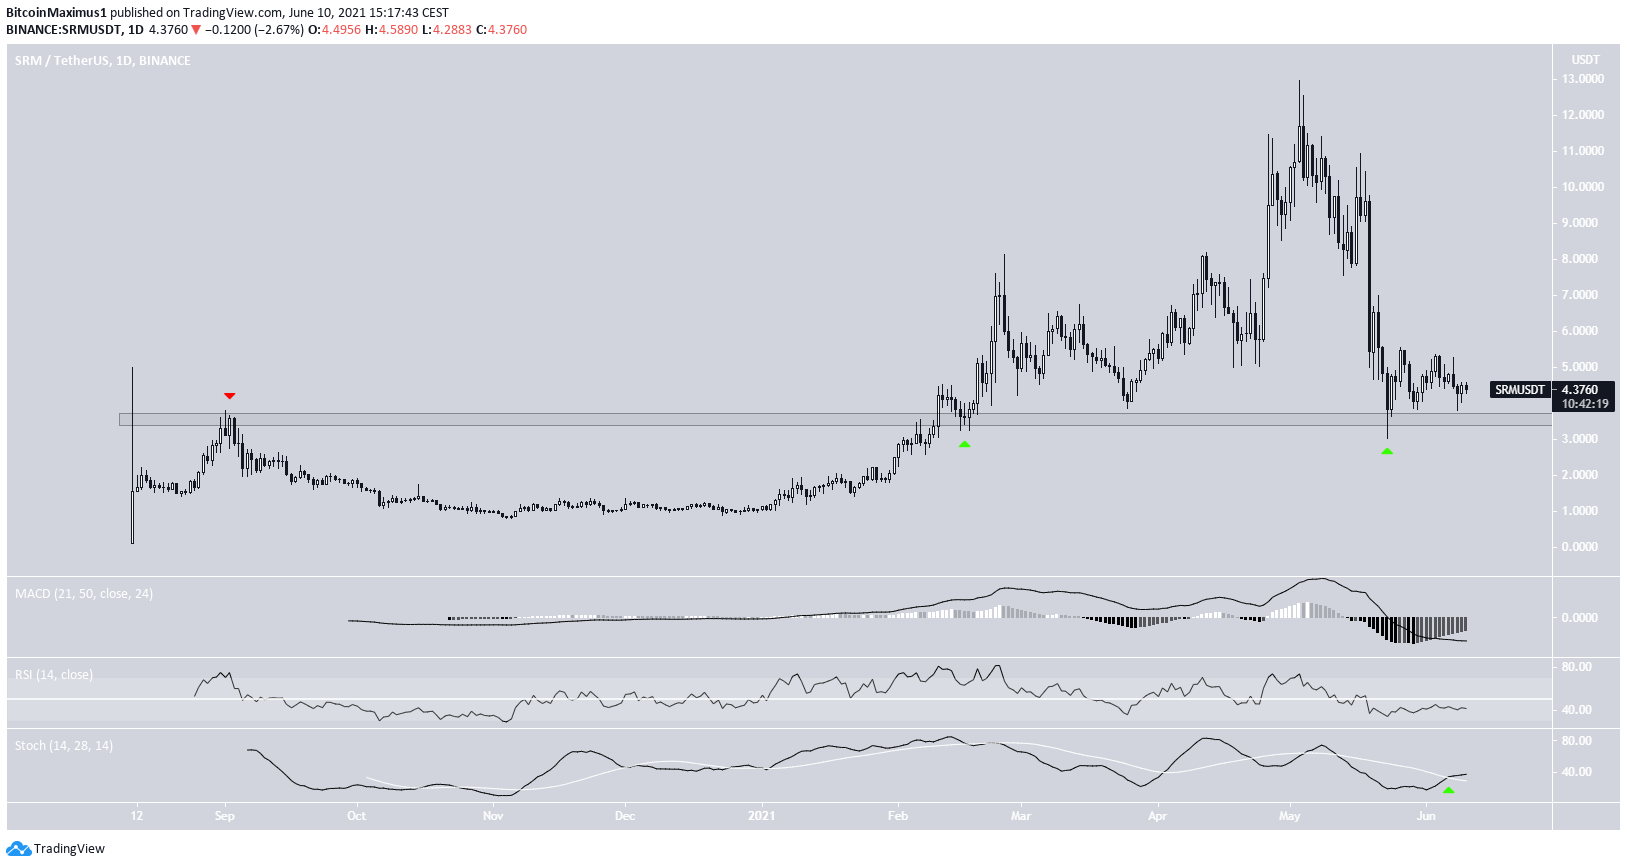
SRM reached a low of $3.03 on May 23 and bounced. This validated the $3.50 area as support, doing so for the second time (green icons). Previously, the same area had acted as resistance in Aug. 2020 (red icon).
Technical indicators are showing some bullish signs. The Stochastic oscillator has made a bullish cross and the MACD is moving upwards. However, the latter is still below 0 and the RSI is below 50. Therefore, they are not sufficient to predict a bullish trend reversal.
Furthermore, the bounce has been weak so far, with SRM barely being above the $3.50 support area.
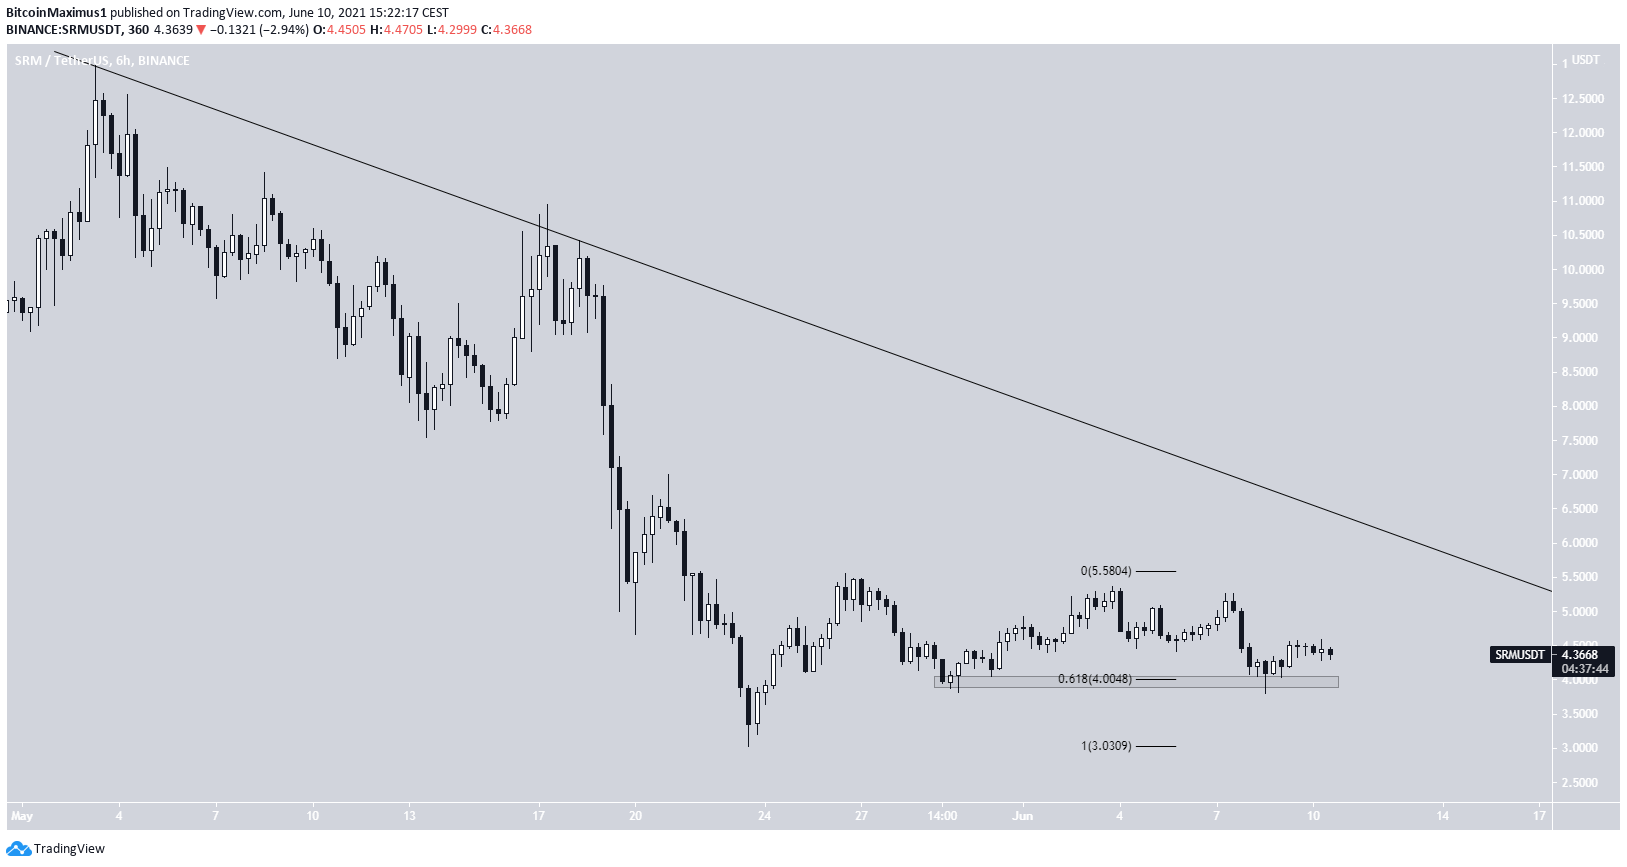
The shorter-term six-hour chart shows a bounce at the $4 support area, which is the 0.618 Fib retracement support level. SRM has created a double bottom at this level, with the second bottom being on June 9.
SponsoredThis is considered a bullish pattern that could initiate an upward movement.
However, the token is also following a descending resistance line in place since the May 3 all-time high. Until it manages to break it, the trend cannot be considered bullish.
Highlights
- SRM has bounced at the $3.30 support area.
- It is following a descending resistance line.
GRT
Since reaching an all-time high price on Feb. 12, GRT has been trading inside a descending parallel channel. On May 19 and 23, it bounced at its support line, creating two long lower wicks (green icons). The bounce also served to validate the $0.63 area as support. This is the 0.786 Fib retracement support level.
Sponsored SponsoredHowever, the upward movement has been weak so far, failing to take GRT in the upper portion of the descending channel. Currently, the token has returned to the $0.63 support area once more.
Technical indicators are providing bullish signs. The Stochastic oscillator has made a bullish cross and the MACD is moving upwards. However, neither has shown considerable strength.
A breakdown below this support area could take GRT all the way down to $0.29, validating the support line of the channel once more.
Sponsored SponsoredUntil the token manages to move in the upper portion of the channel, we cannot consider the trend bullish.

Highlights
- GRT is trading inside a descending parallel channel.
- There is support at $0.63 and $0.29.
For BeInCrypto’s latest bitcoin (BTC) analysis, click here.
