Be[in]Crypto takes a look at Bitcoin (BTC) on-chain indicators, focusing on the Supply Last Active for different periods of time.
BTC supply last active 1+ years ago
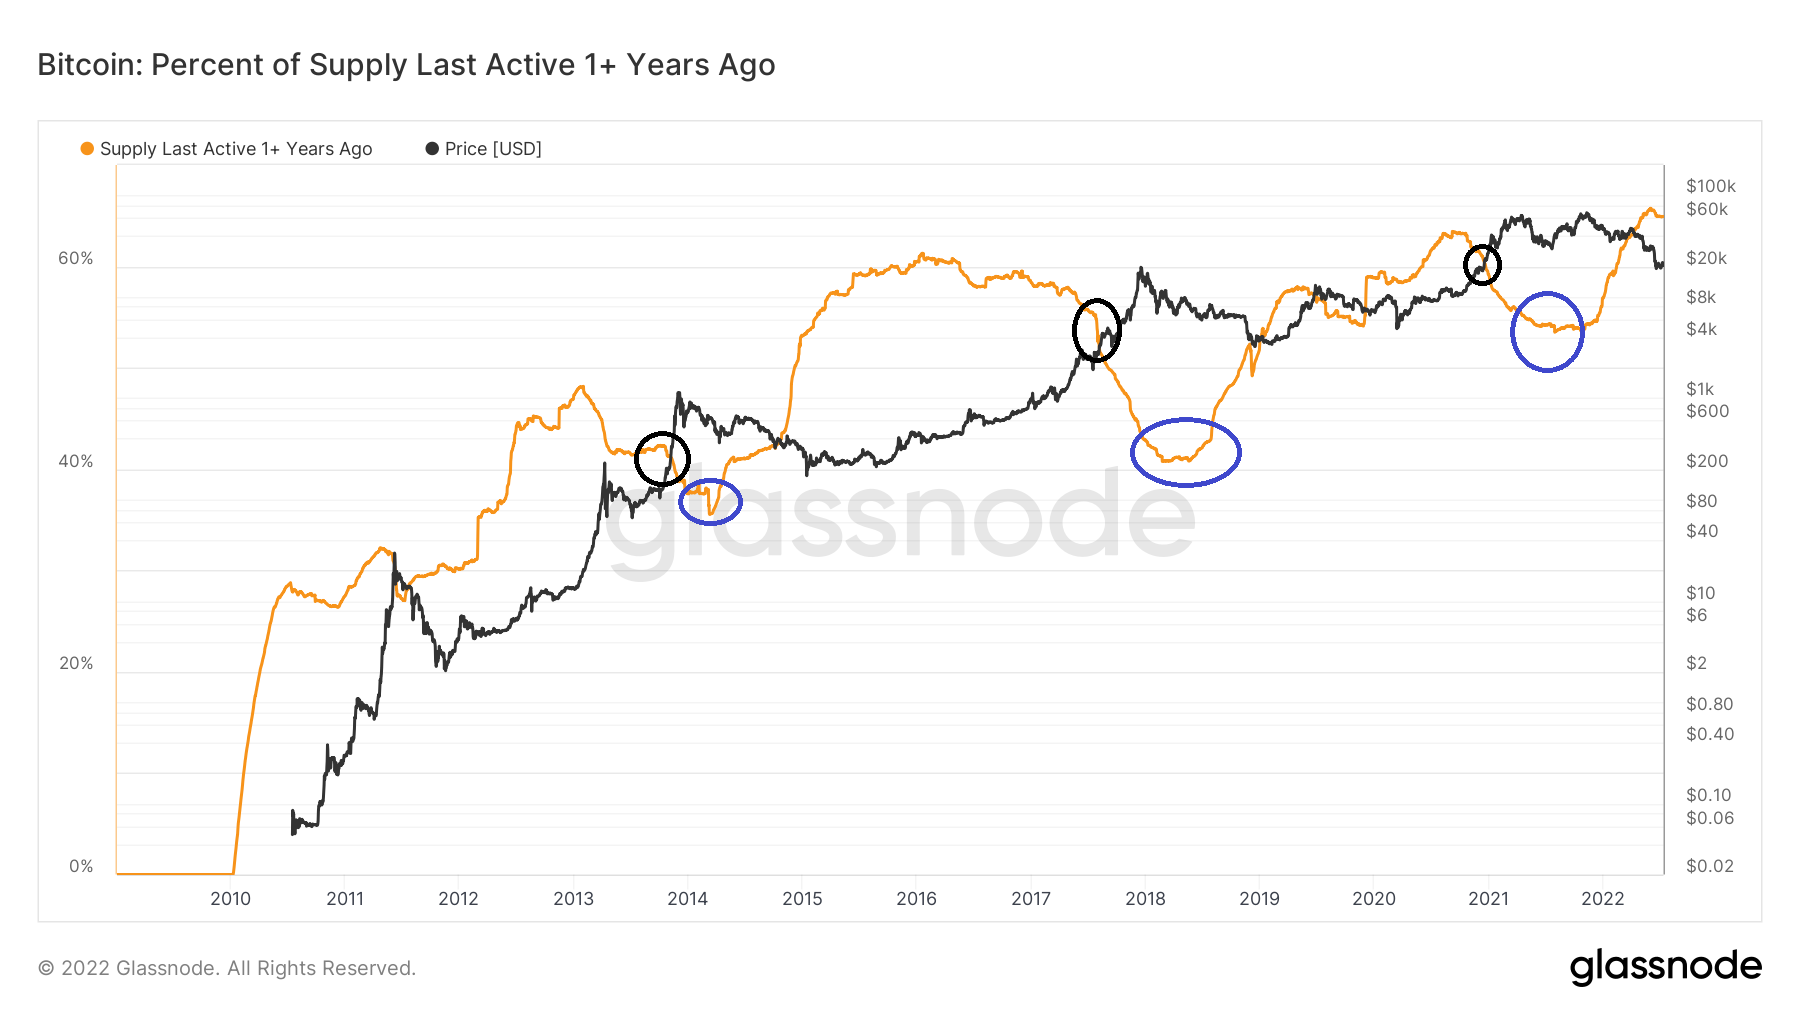
SponsoredThe supply last active more than one year ago usually falls sharply prior to the market reaching a local high (black circles). Afterward, it often bottoms out during the beginning of bear markets (blue circle), and then begins to increase once more afterward.
The reason for this is that long-term holders usually distribute their holdings prior to a new all-time high, and then scale back in once the price reaches a bottom.
At the beginning of June, Supply Last Active more than one year ago reached a new all-time high of 65.72%. Previously, values close to 60% meant that a bottom had already been reached.
In more practical terms, this means that 65% of the supply has not moved since July 2021, when the price was at $35,000.
Sponsored SponsoredPrevious patterns
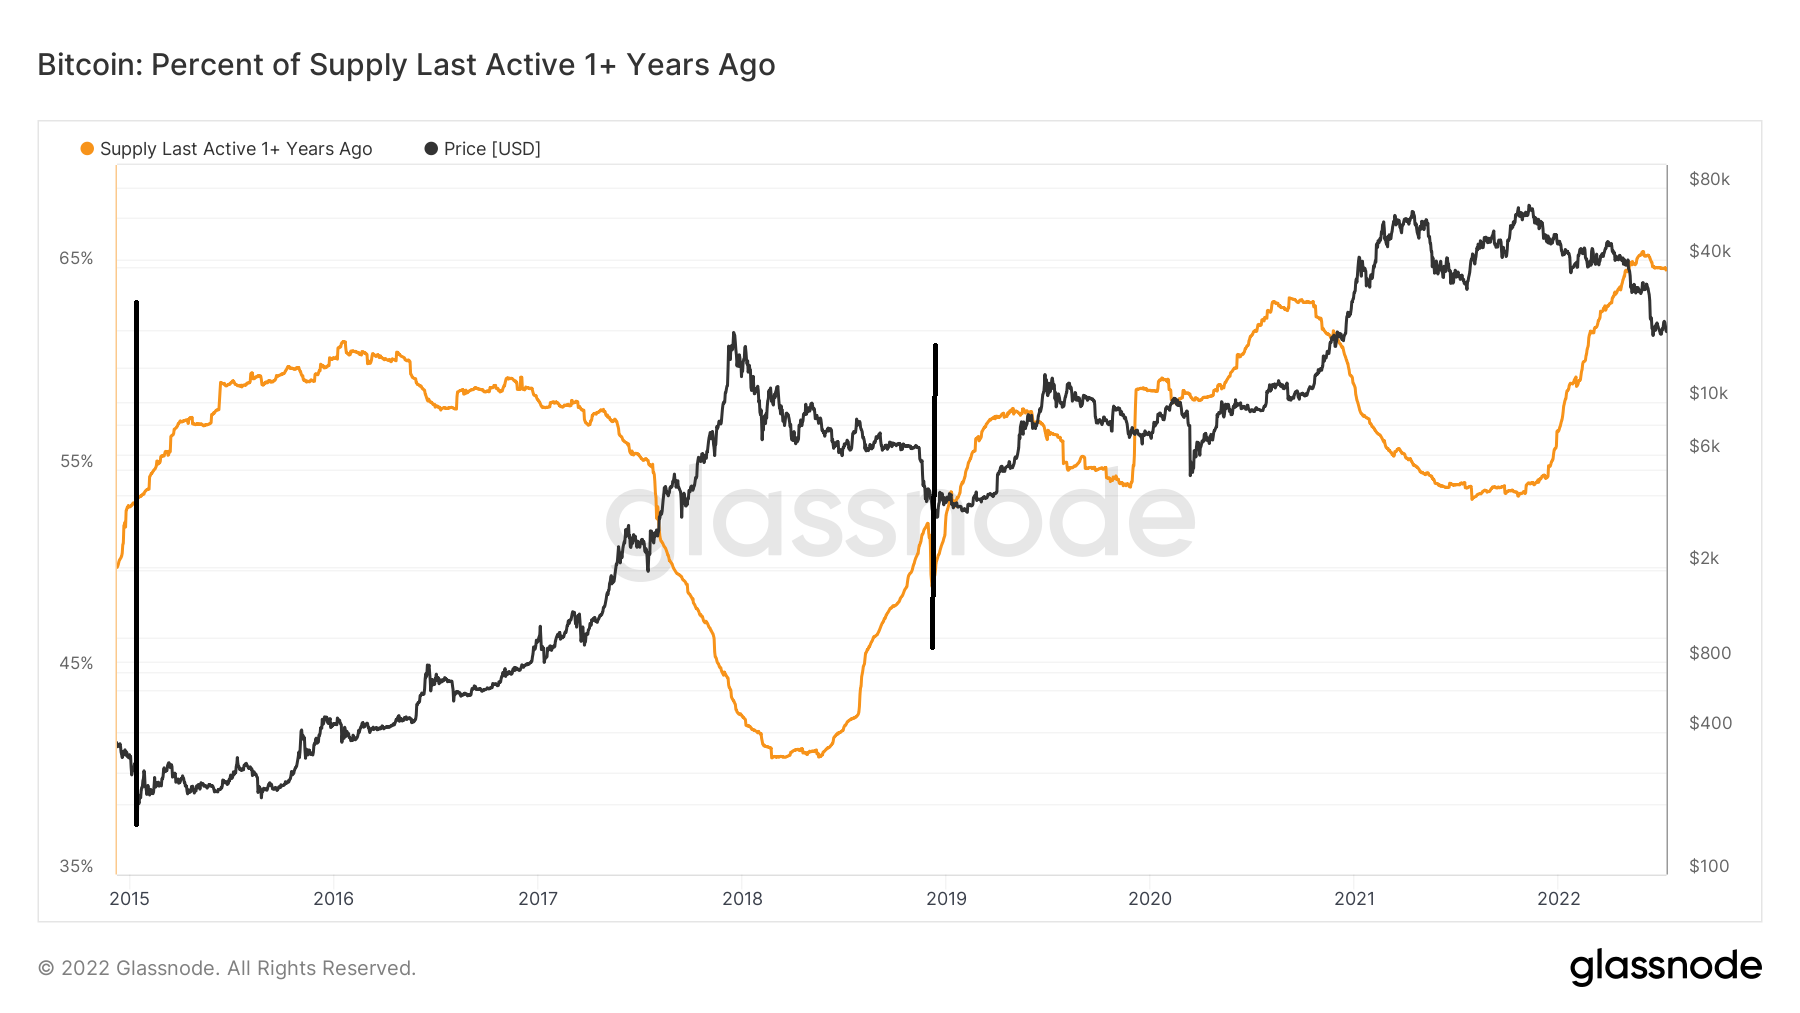
An interesting development arises when looking at the 2015 and 2019 bottoms (black lines) and the Supply Last Active more than one year ago indicator. In 2015, the bottom was reached at a value of 53.4%, while the first higher low was made at 59.4%. In 2019, the bottom was reached at 50% while the first higher low at 58.6%. So, the current reading of 65% is dissimilar to those of 2015 and 2019, respectively.
Since the Supply Last Active indicator has already moved up sharply after a period of decrease, it is likely that BTC is in a bear market.
However, due to the unusual reading relative to previous cycles, it is not yet clear if a bottom has been reached or if another capitulation wave will follow.

Long-term holders
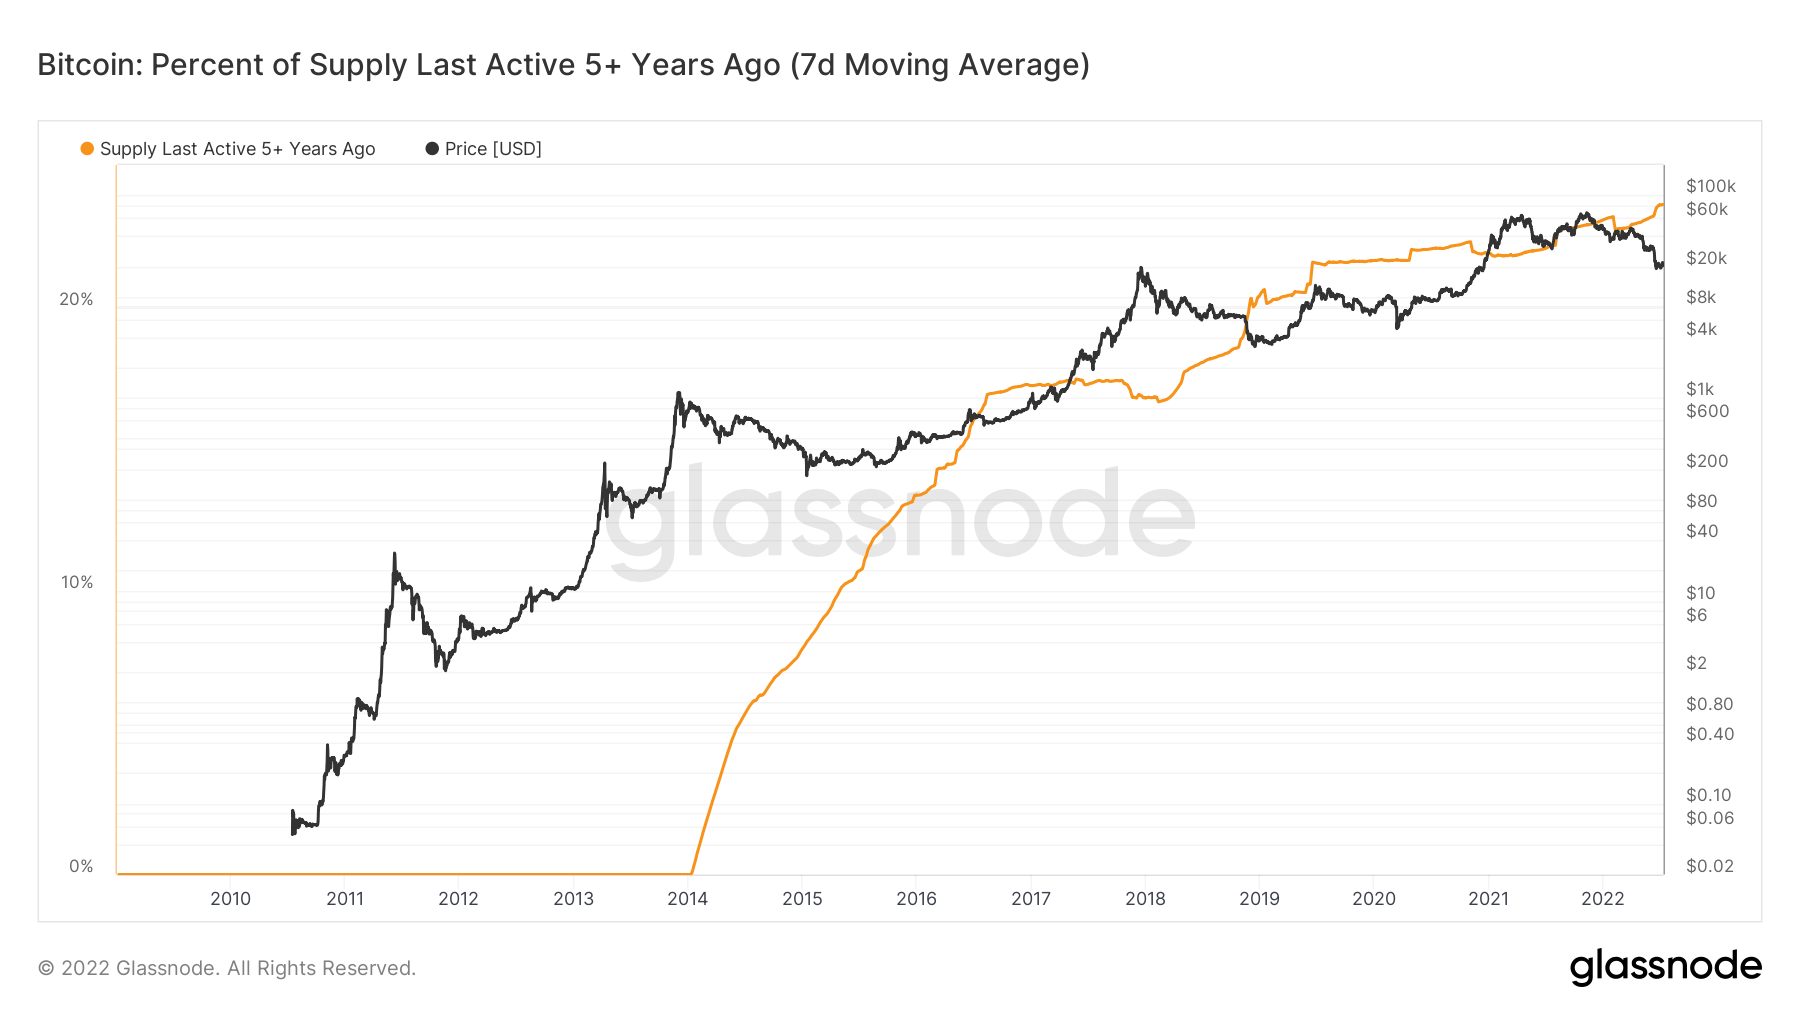
An interesting reading comes from looking at the percentage of supply that has not moved for more than five years.
Despite some slight decreases prior to market cycle tops, the supply has been constantly moving upwards and reached a new all-time high of 23.60% in June.
So, this means that there are still holders that have not sold for a long period of time and are still accumulating.
For Be[in]Crypto’s latest bitcoin (BTC) analysis, click here.


