On June 7, the SEC announced that they are investigating Binance for potentially breaking security laws. The price of Binance Coin (BNB) has decreased slightly as a result.
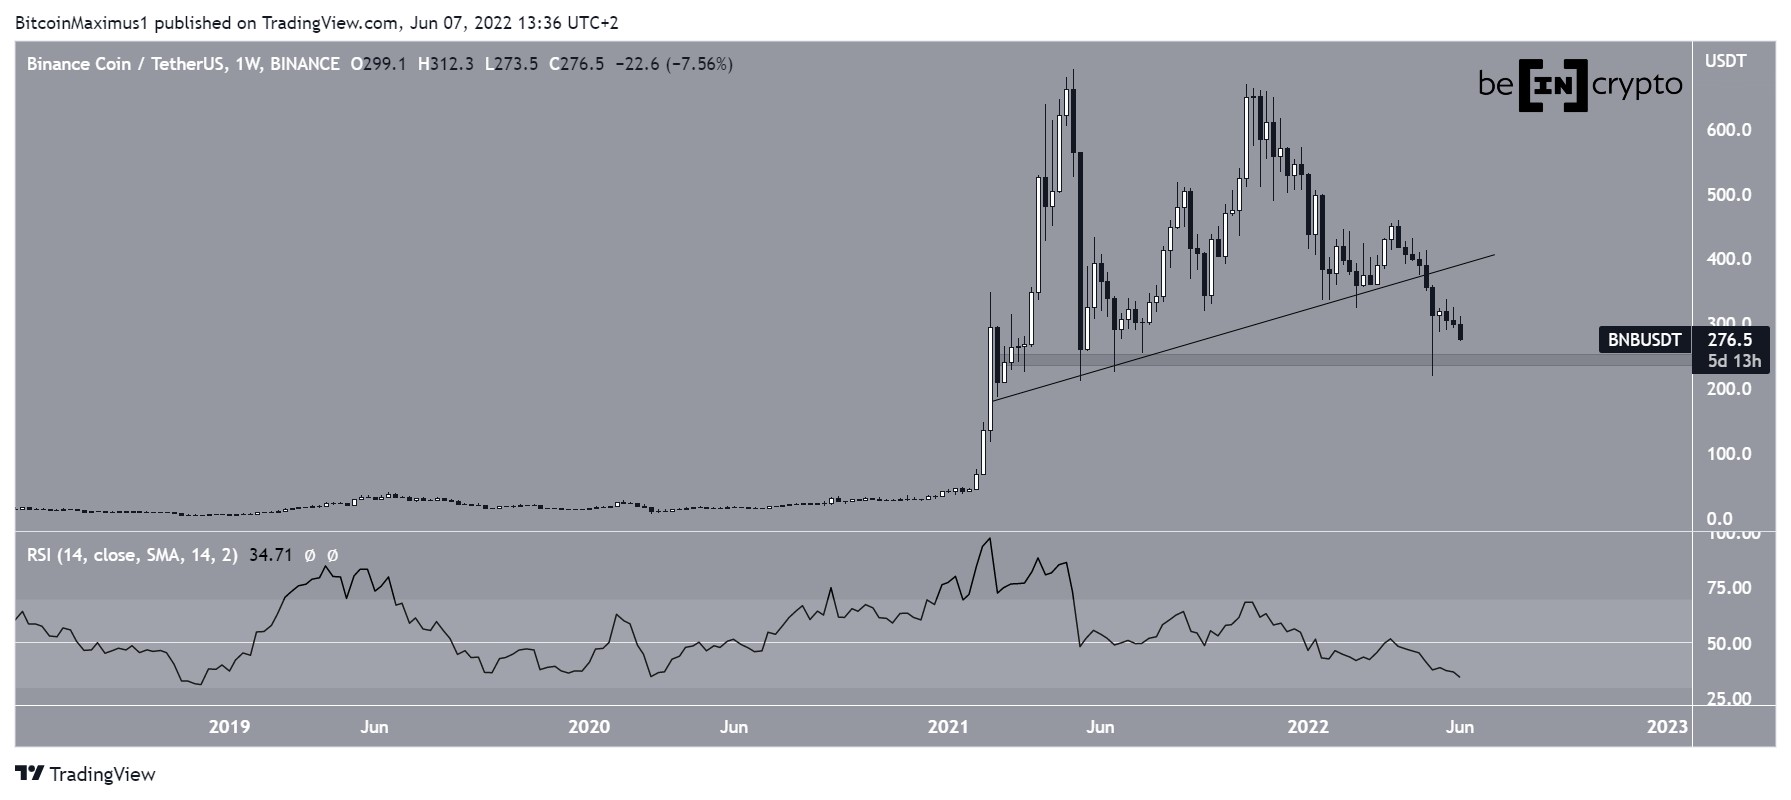
BNB has been falling since reaching an all-time high price of $691 on May 10, 2021. The price created a slightly lower high in Nov. 2021 and has been decreasing at a more accelerated rate since.
SponsoredIn May 2022, the price broke down from an ascending support line that had previously been in place since early 2021. The breakdown from such a long-term structure is considered a significantly bearish development. The downward movement led to a low of $218.8. The ensuing bounce created a long lower wick and served to validate the $225 area as support.
Besides this level, there are no other visible horizontal support areas until close to $100.
The weekly RSI is below 50, in what is considered a sign of a bearish trend.

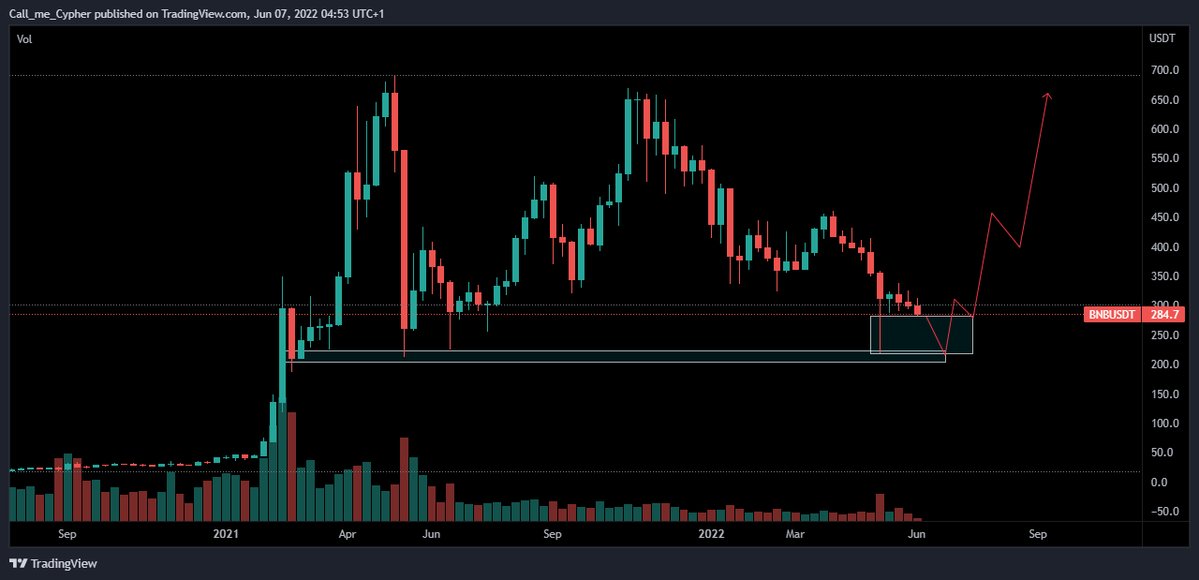
Cryptocurrency trader @Call_Me_Cypher tweeted a chart of BNB, stating that the price could fall down close to $200. This aligns with the support area outlined in the image above.
Weak BNB bounce
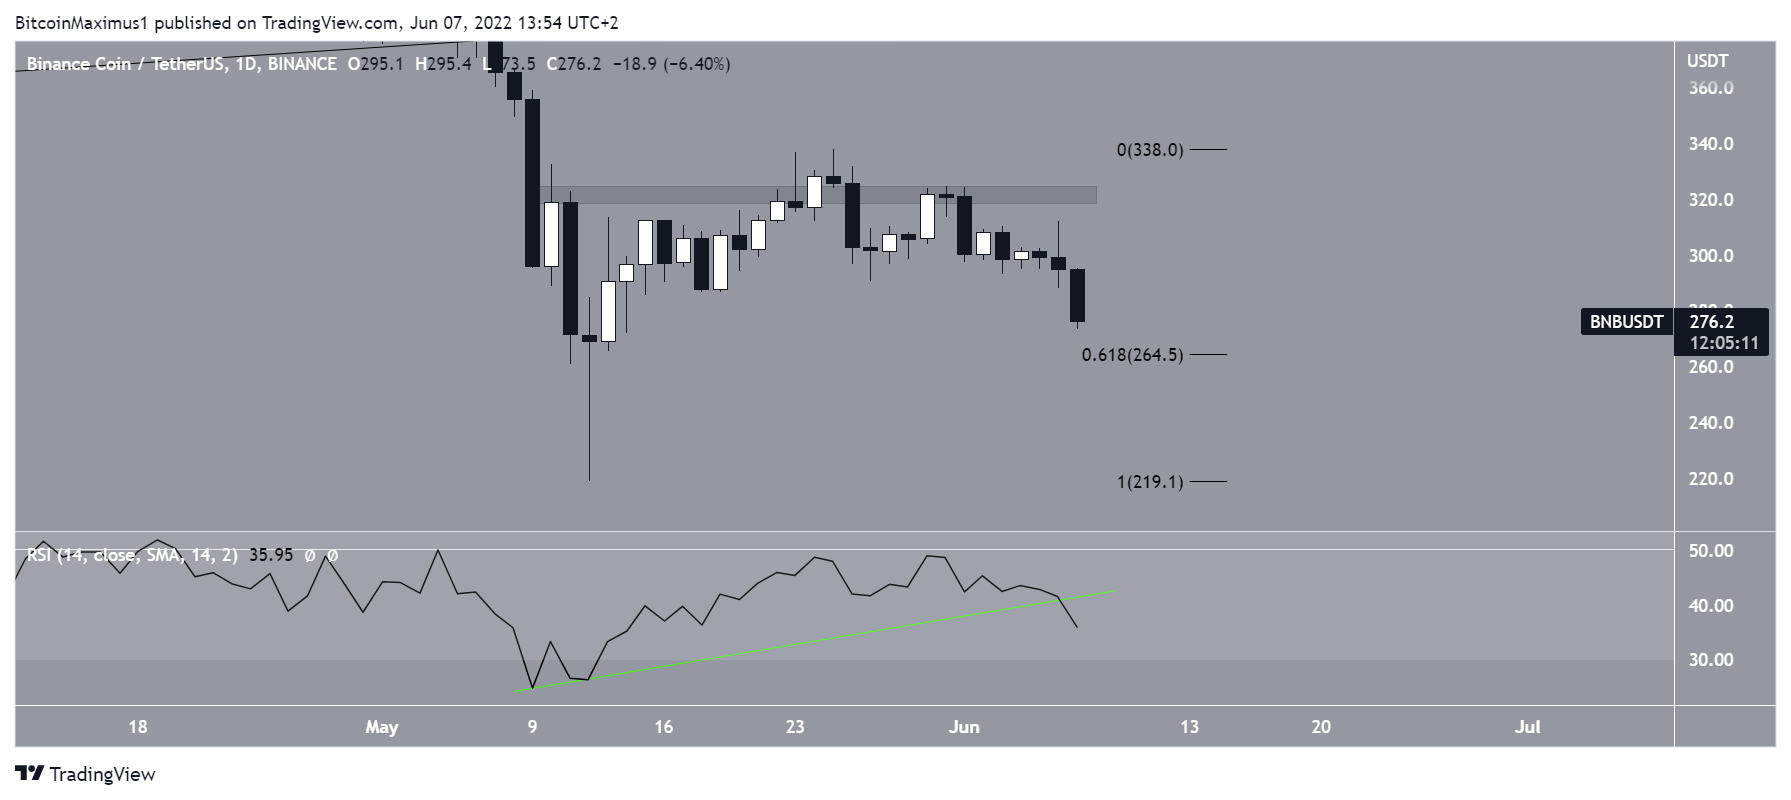
The daily chart shows that the May 12 bounce was preceded by a bullish divergence in the RSI (green line). However, the trendline of the divergence is no longer intact. This is a sign that lower prices could follow. Also, the RSI has been rejected by the 50 line and is decreasing.
The closest support area is at $265. This is the 0.618 Fib retracement support level, and the final support prior to the wick lows of May 12.

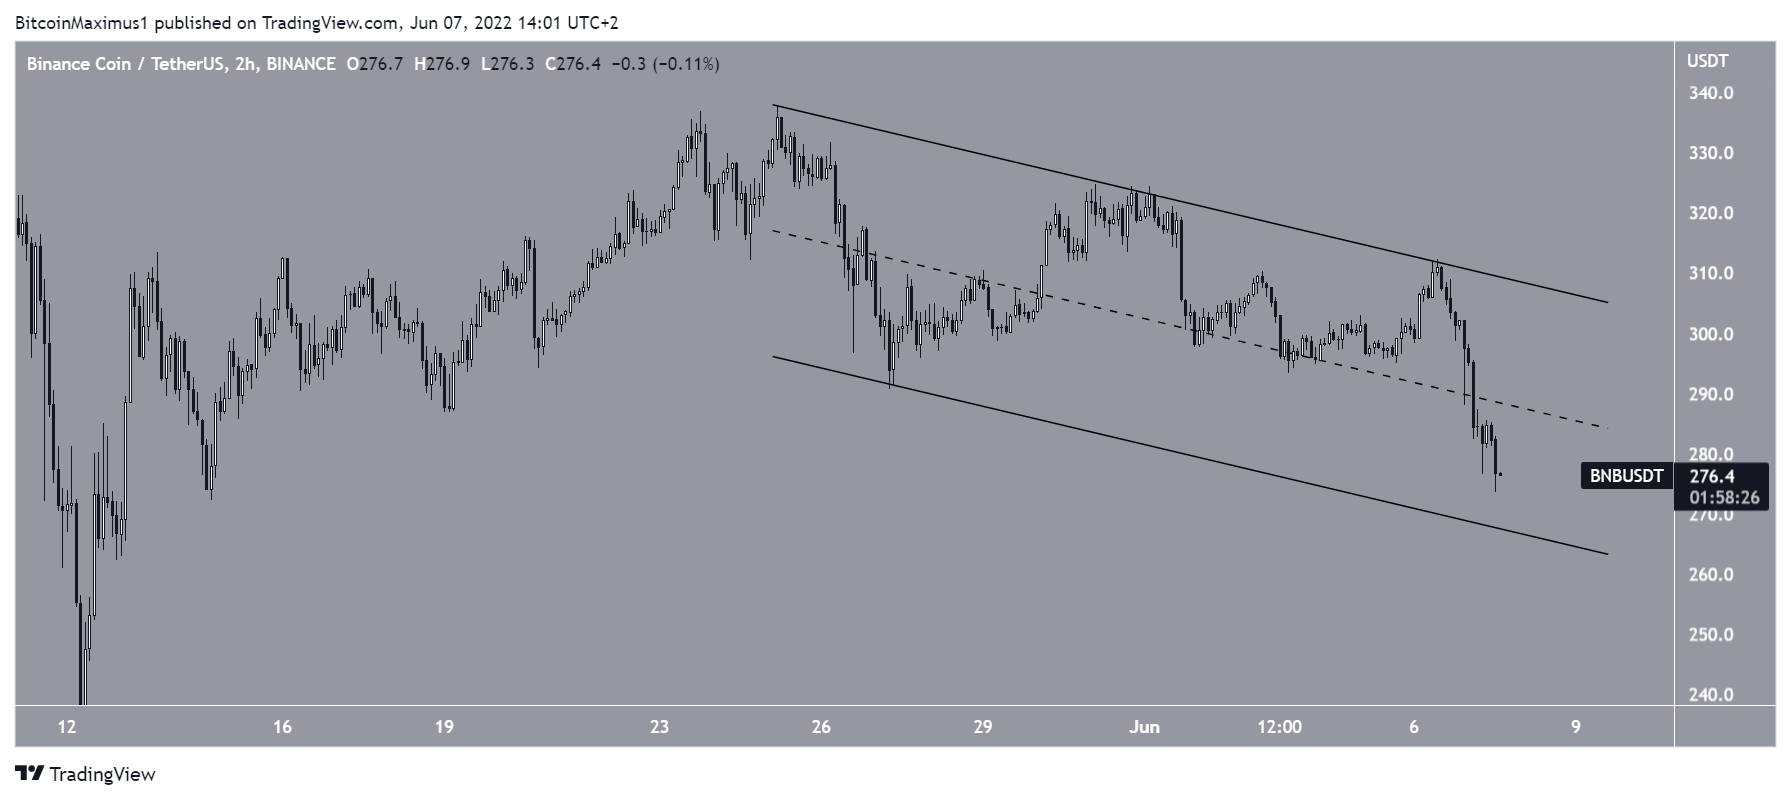
The two-hour chart shows that BNB could be trading inside a descending parallel channel, though the support line of the structure is not yet validated sufficient times.
The support line falls at $265, coinciding with the previously outlined Fib support area.
So, due to the confluence of these levels, the $265 area seems to be a likely level for a bounce.
However, the longer-term trend still remains bearish due to the readings from the weekly and daily time frames.
For Be[in]Crypto’s latest bitcoin (BTC) analysis, click here


