
Avalanche (AVAX) has been gradually decreasing inside a descending wedge since May 12, and possibly initiated a reversal on June 19.
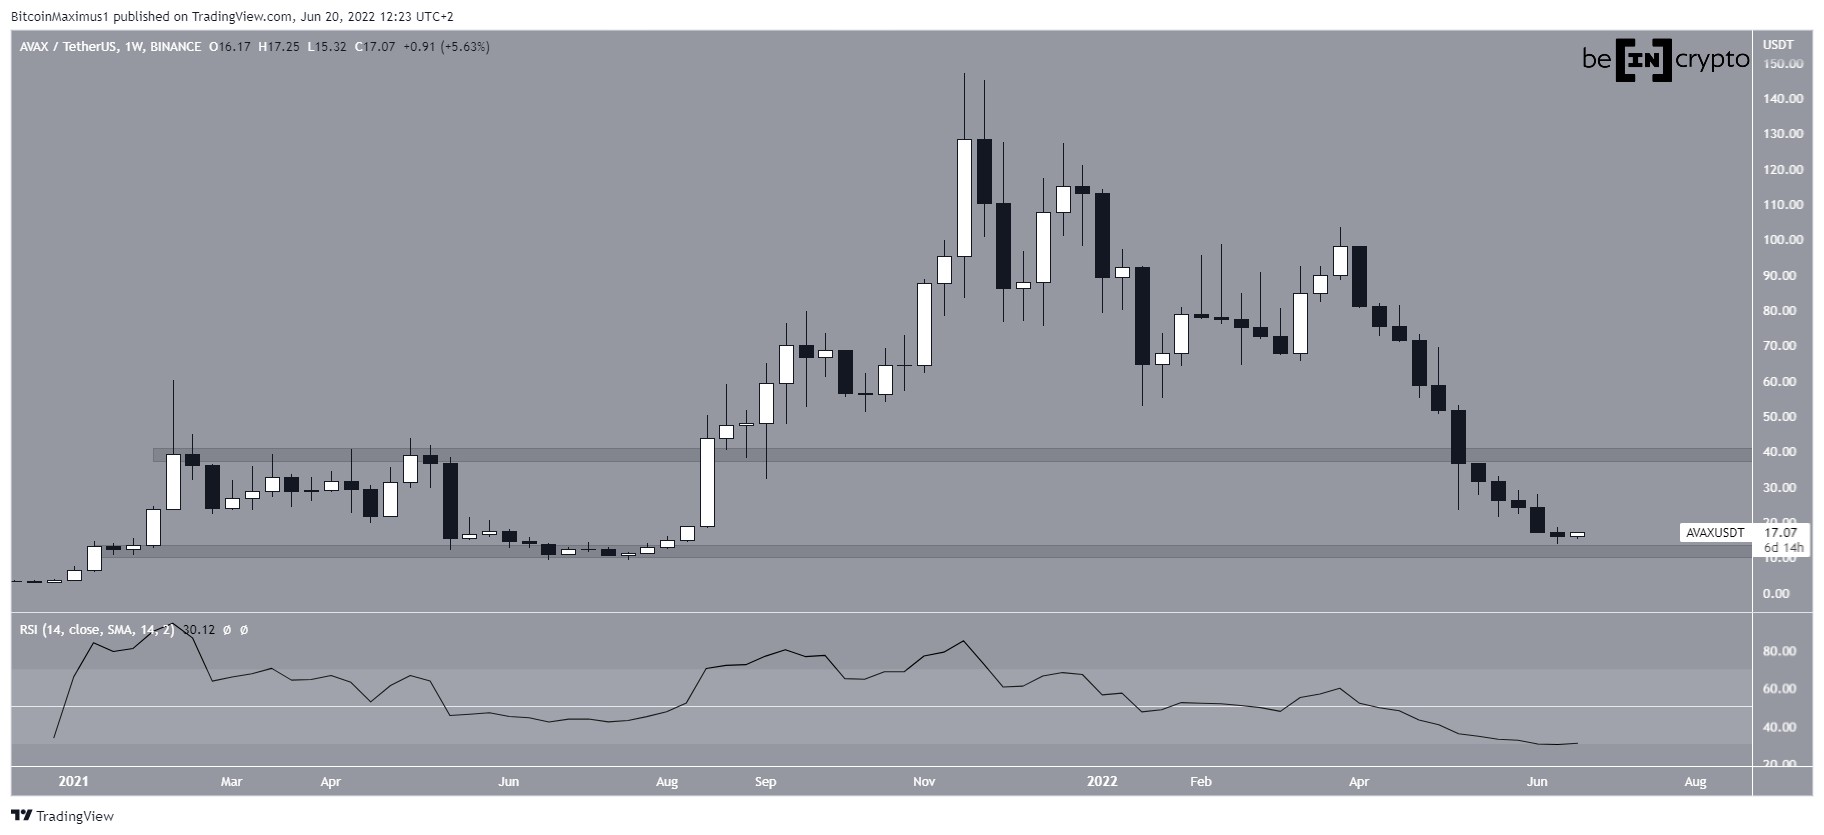
AVAX has been falling since reaching an all-time high price of $147 on Nov. 21, 2021. So far, the downward movement has led to a low of $13.71 on June 19, 2022. The price has been increasing since and is currently trading at $17.
SponsoredThe weekly chart suggests that AVAX is trading inside a long-term range between $12 and $40. The range had previously been in place in the period between Jan – Aug in 2021, prior to the breakout that led to the all-time high.
AVAX attempts breakout
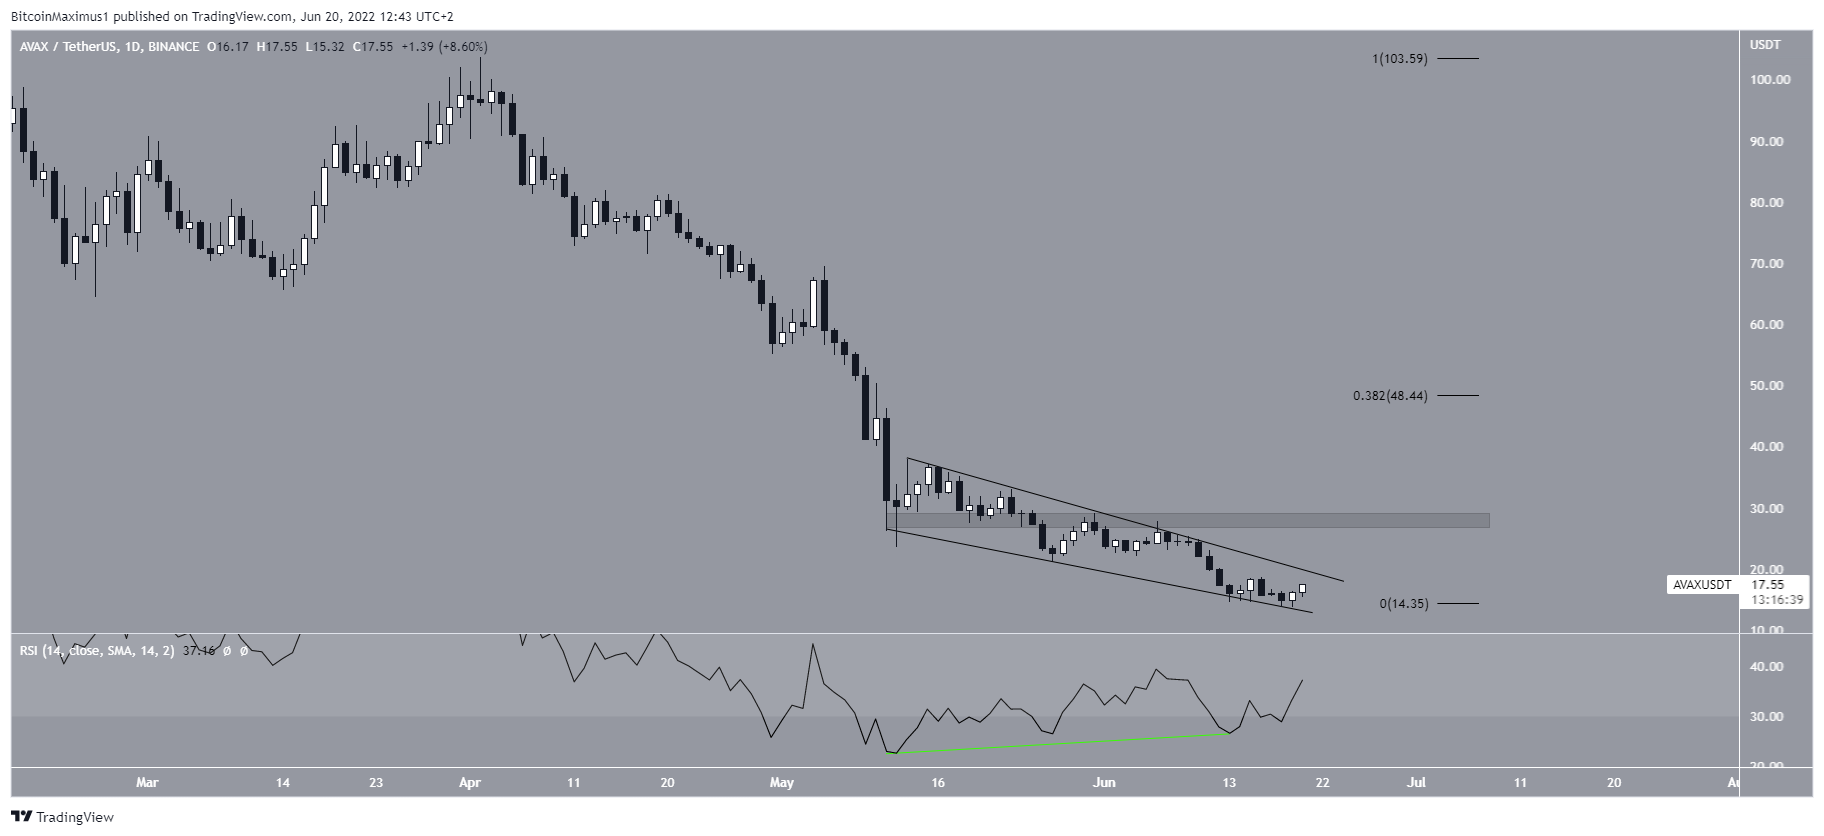
The daily chart shows that AVAX has been decreasing inside a descending wedge since May 12. The descending wedge is considered a bullish pattern, meaning that a breakout from it would be the most likely scenario.
Sponsored SponsoredFurthermore, the pattern has been combined with a significant bullish divergence in the daily RSI (green line), supporting the possibility of a breakout.
If a breakout occurs, the first minor resistance area would be at $28, while the next one is at $48. The former is a horizontal resistance area while the latter is the 0.382 Fib retracement resistance level when measuring the entire downward movement.
Wave count analysis
Cryptocurrency trader @JacobEmmerton tweeted an AVAX chart, stating that the price has another downward movement to complete before reversing.
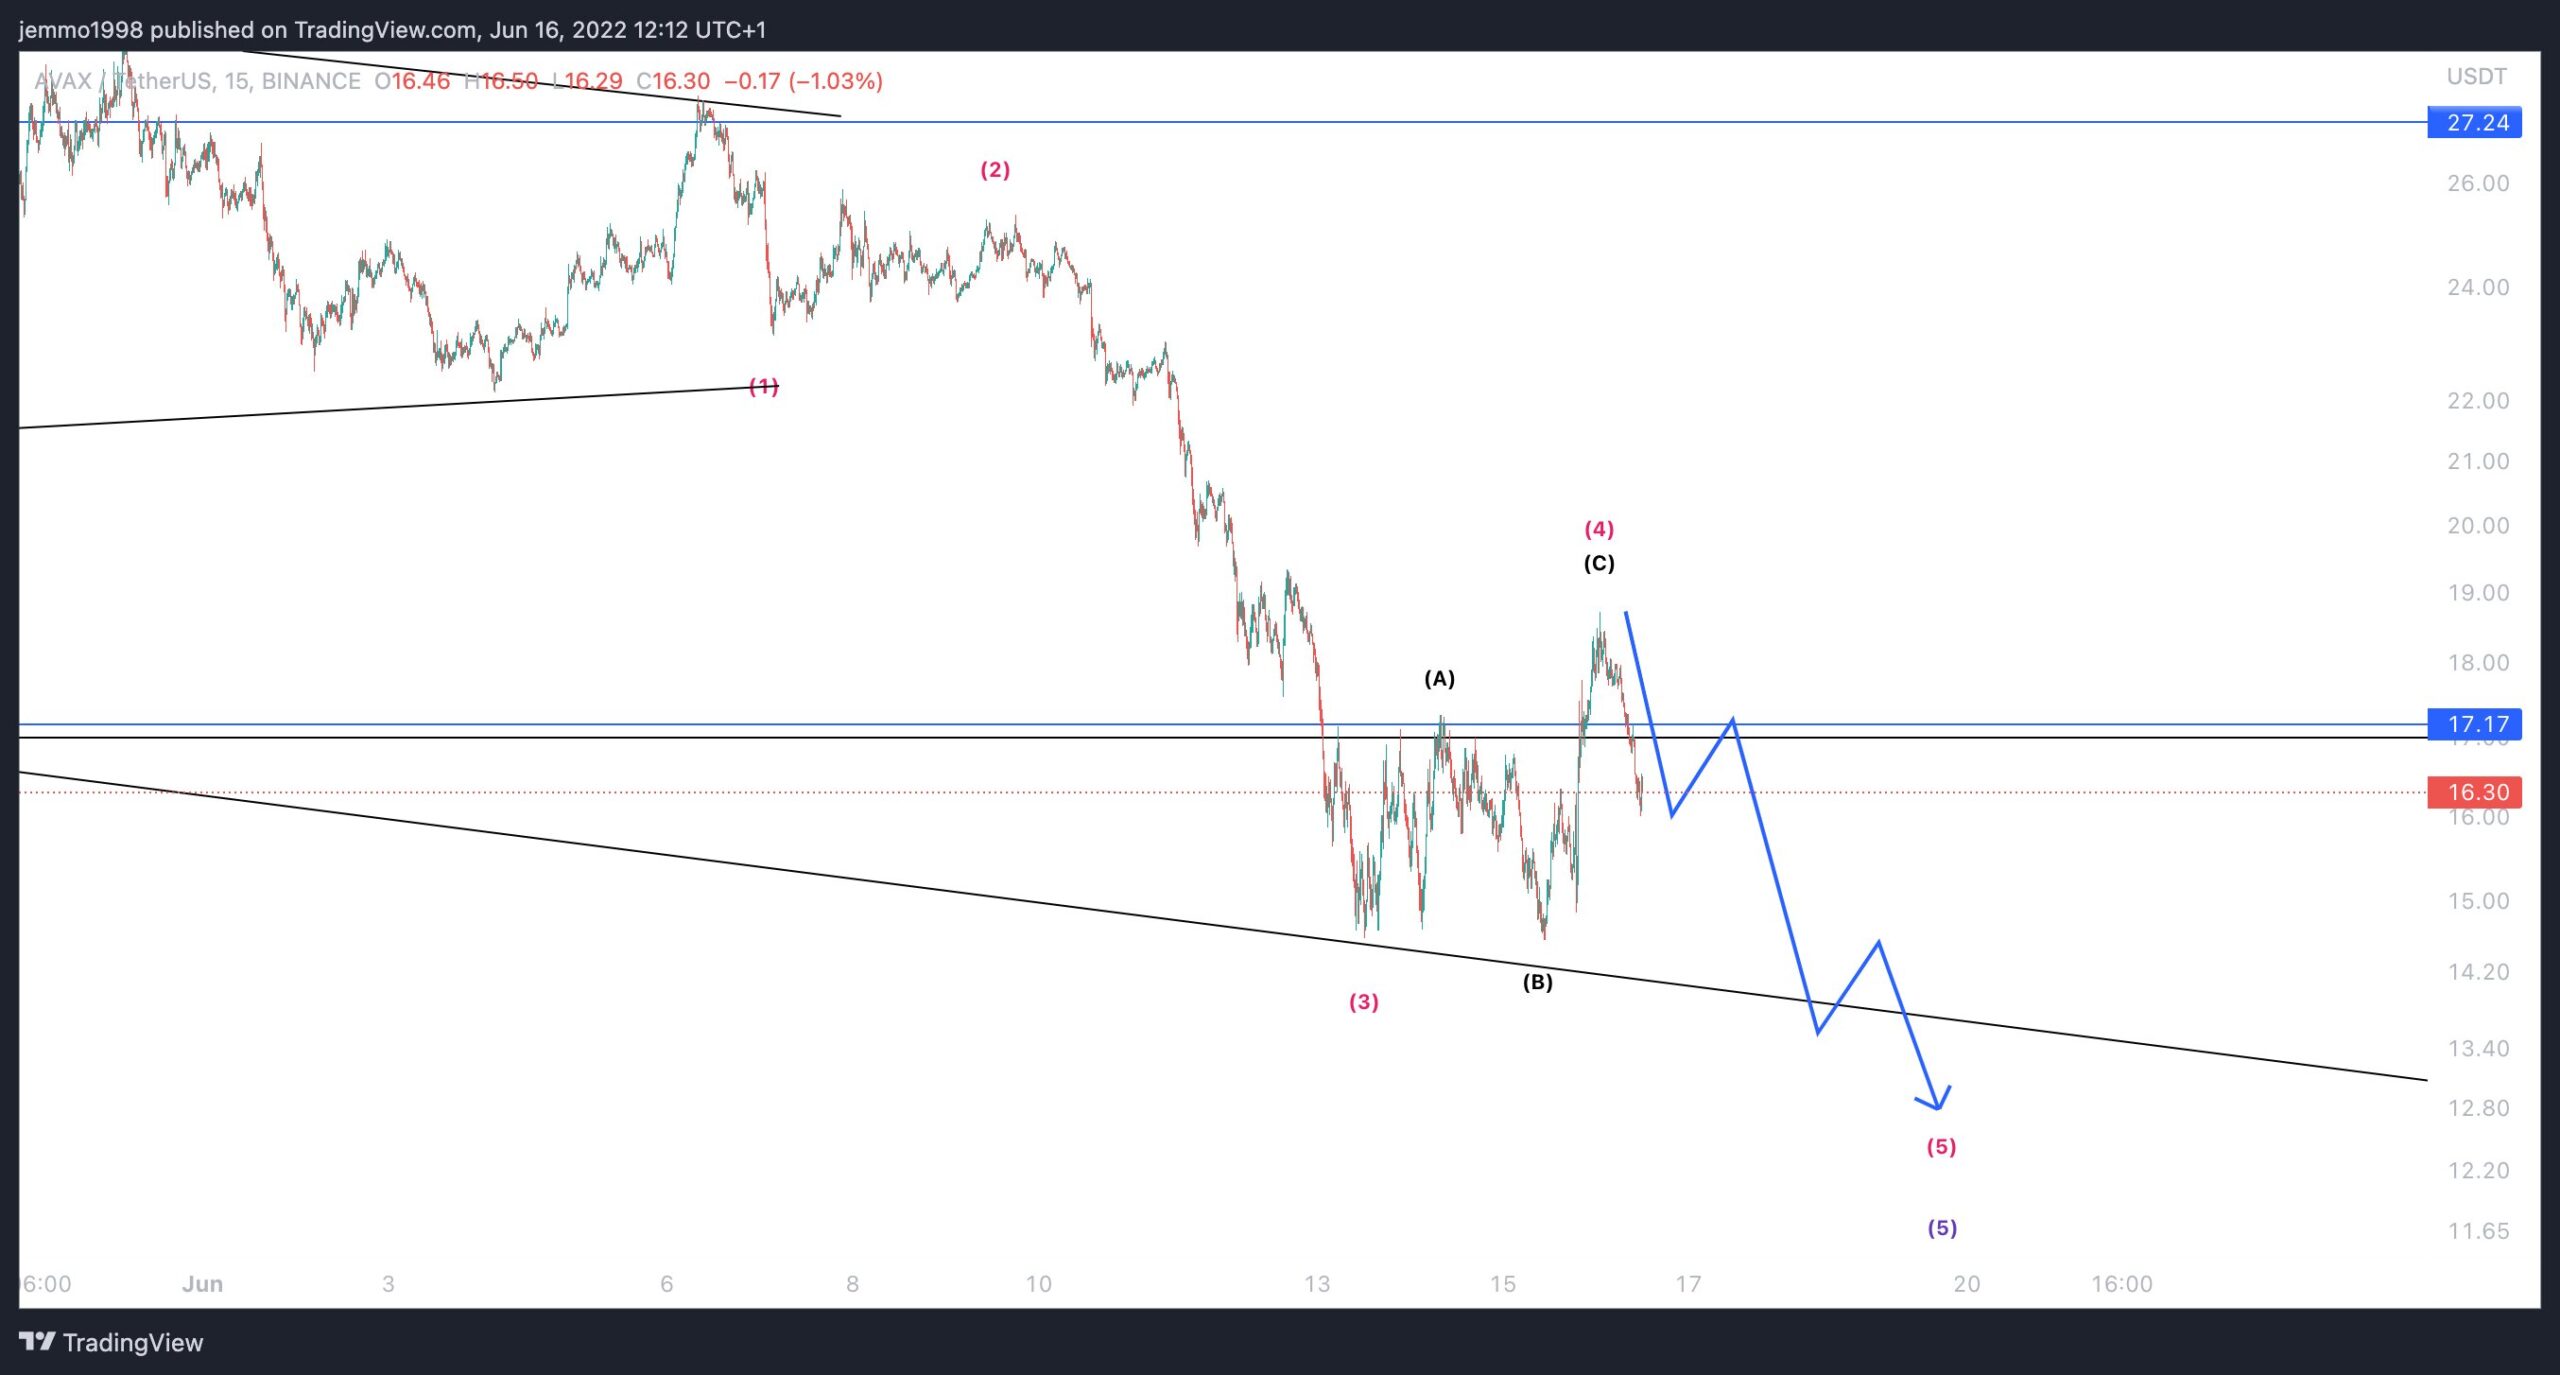
Since the tweet, the price has reached the proposed target and bounced.
It is possible that measuring from the beginning of April, AVAX has completed wave three of a five wave downward movement, and is currently in wave four (black). The sub-wave count is given in red.
When measuring the length of wave three, the closest resistance area would be at $40, created by the 0.382 Fib retracement resistance level. This would fall between the two previously outlined resistance areas.
So, the wave count is in alignment with the readings from the daily chart, suggesting that a significant bounce will soon transpire.

For Be[in]Crypto’s latest bitcoin (BTC) analysis, click here
