
Alpha Venture DAO (ALPHA) has been increasing since the daily RSI generated a bullish divergence on June 18. However, it has yet to reclaim any important horizontal resistance levels.
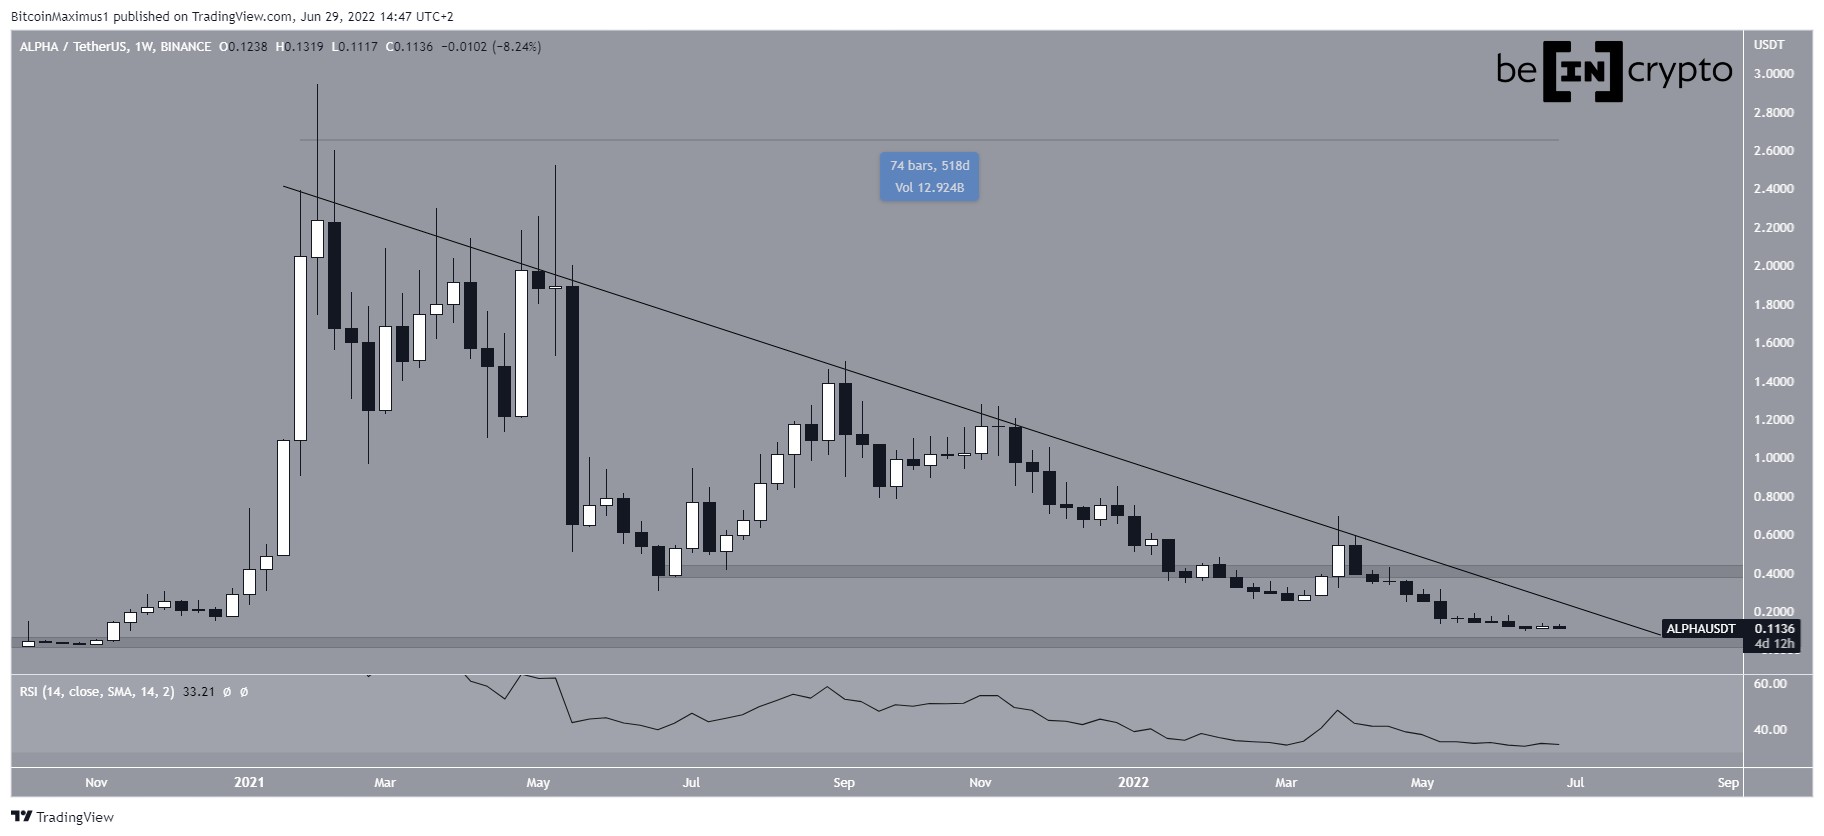
ALPHA has been falling since reaching an all-time high of $2.94 on Feb 5 2021. The downward movement led to a low of $0.093 on June 18. This amounted to a decrease of 96% since the all-time high.
SponsoredThe entire downward movement has been contained underneath a descending resistance line, which has so far been in place for 518 days.
While the RSI is at a new all-time low, it is neither oversold nor has it generated any bullish divergence. So, there are no signs of a potential bullish divergence present.
The main support and resistance levels are at $0.04 and $0.42, respectively.
Growing bullish divergence
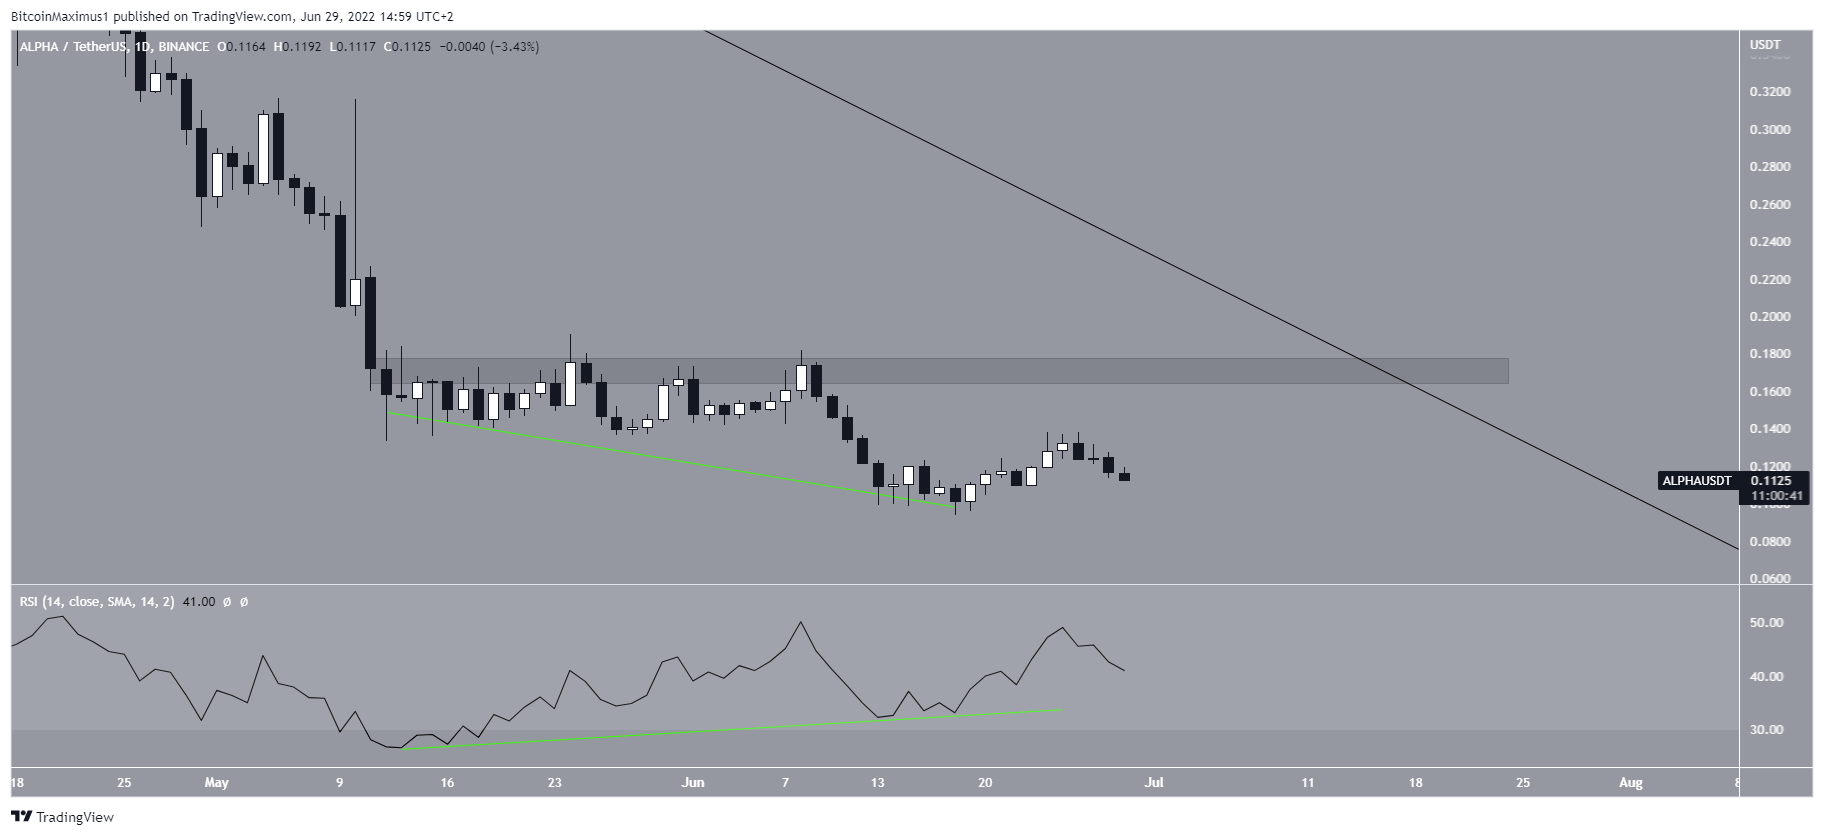
The daily chart provides a slightly more bullish picture than the weekly one. The main reason for this is the bullish divergence (green line) that has developed in the RSI.
If the bullish divergence plays out, it could lead to an upward movement towards the $0.175 horizontal resistance area, which also coincides with the aforementioned descending resistance line.
Despite this bullish divergence, the RSI has yet to move above 50, a level which is considered a sign of a bullish trend.
Short-term ALPHA movement
SponsoredCryptocurrency trader @Thetradinghubb tweeted a chart of ALPHA, stating that a reclaim of the $0.135 resistance area could lead to a significant upward movement.
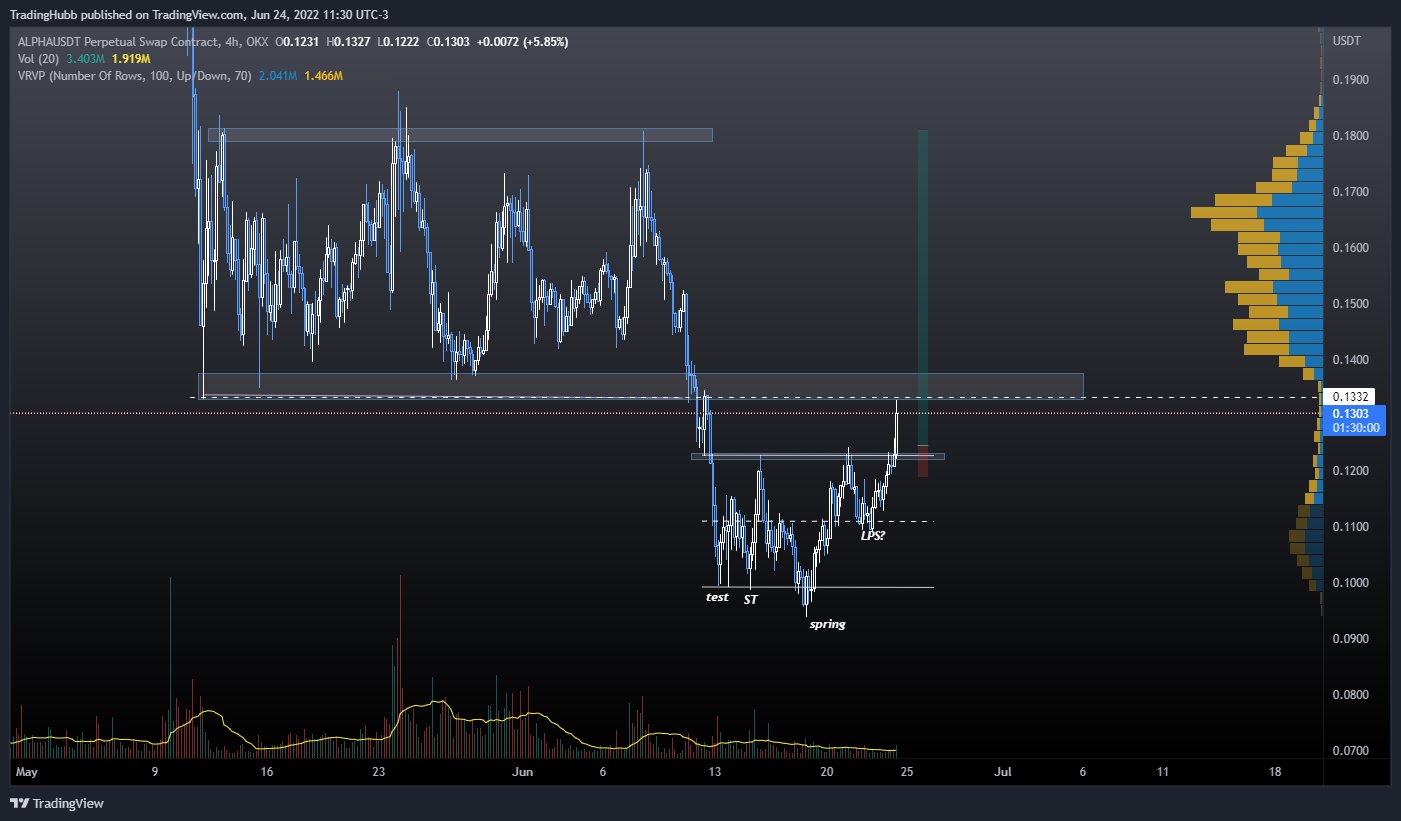
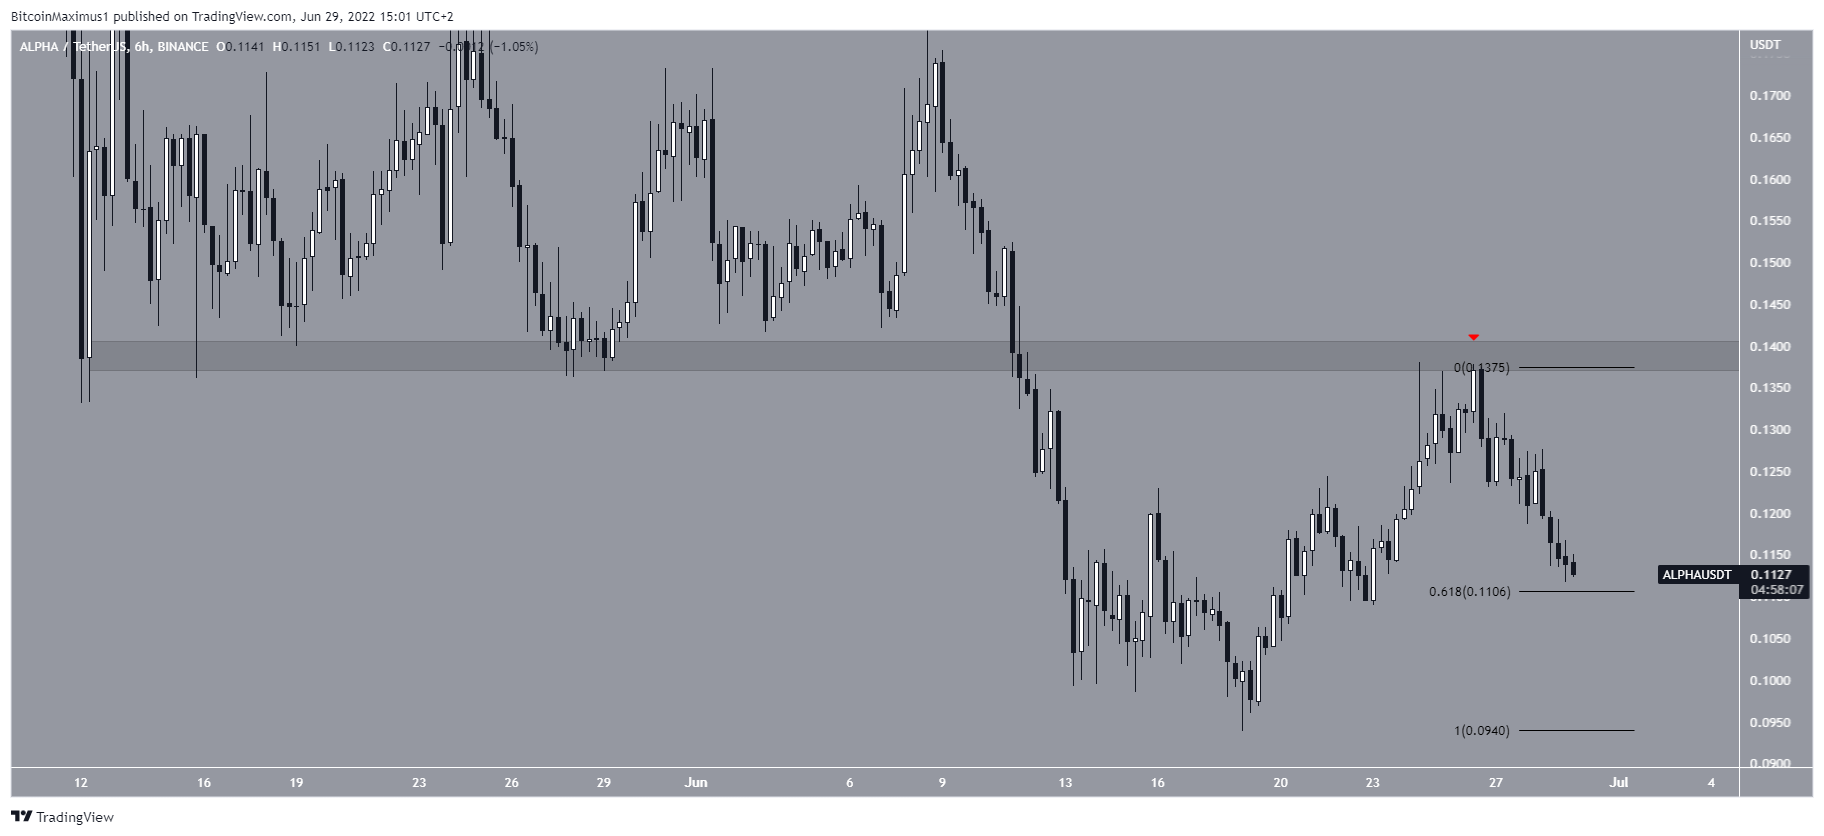
But the price failed to reclaim this $0.135 area and was rejected by it instead (red icon), initiating the ongoing downward movement.
Currently, the price is trading just above the 0.618 Fib retracement support level at $0.11. If this level fails to initiate a bounce, the price would likely decrease towards its yearly lows of $0.094
For Be[in]Crypto’s latest bitcoin (BTC) analysis, click here
