
On Apr 2, Cardano initiated a rapid move. By the end of Apr 3, it had reached a high of over $0.1.
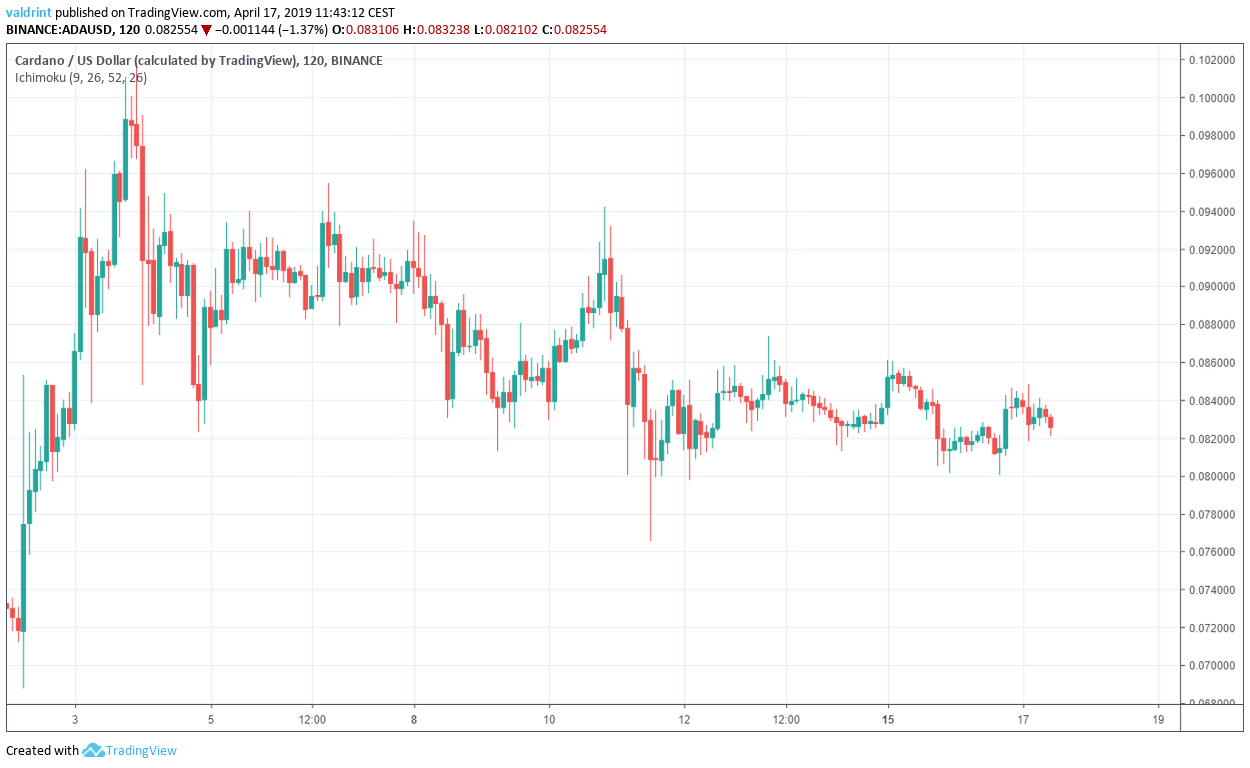
Cardano has since been on a gradual downtrend. It reached a low around $0.80 on Apr 11.
Let’s find out:
SponsoredCardano (ADA): Trends and Highlights for Apr 17, 2019
- Cardano reached a high on Apr 3 and has been on a downtrend since.
- ADA/USD is trading inside a descending triangle.
- It is following a long-term ascending support line.
- The 10- and 20-day moving averages have made a bearish cross..
- There is support near $0.075
Descending Triangle
On Apr 2, the price reached a low of $0.079. Several market cycles have been completed since. The price has reached the same level four times.
Tracing these lows gives us a horizontal support line:

On Apr 4, the price made a high of $0.0947. A gradual drop was followed by a gradual increase. The price has reached several lower highs.
Tracing these highs gives us a descending resistance line. The resistance and support lines combine to create a descending triangle:
Sponsored Sponsored
It is likely that the price will keep trading inside the confines of this triangle until a decisive move occurs.
In order to figure out the direction of the move, we need to take a look at a longer time-frame combined with technical indicators.
Relative Strength Index
We begin analyzing the price of Binance from Mar 1 to Apr 17 alongside the MACD and moving averages (MA).
Moving averages are tools used in technical analysis to smooth out price action. It is a lagging indicator since it is based on past prices. The relationship between short and long-term moving averages can help in identifying the beginning and end of a trend.
Sponsored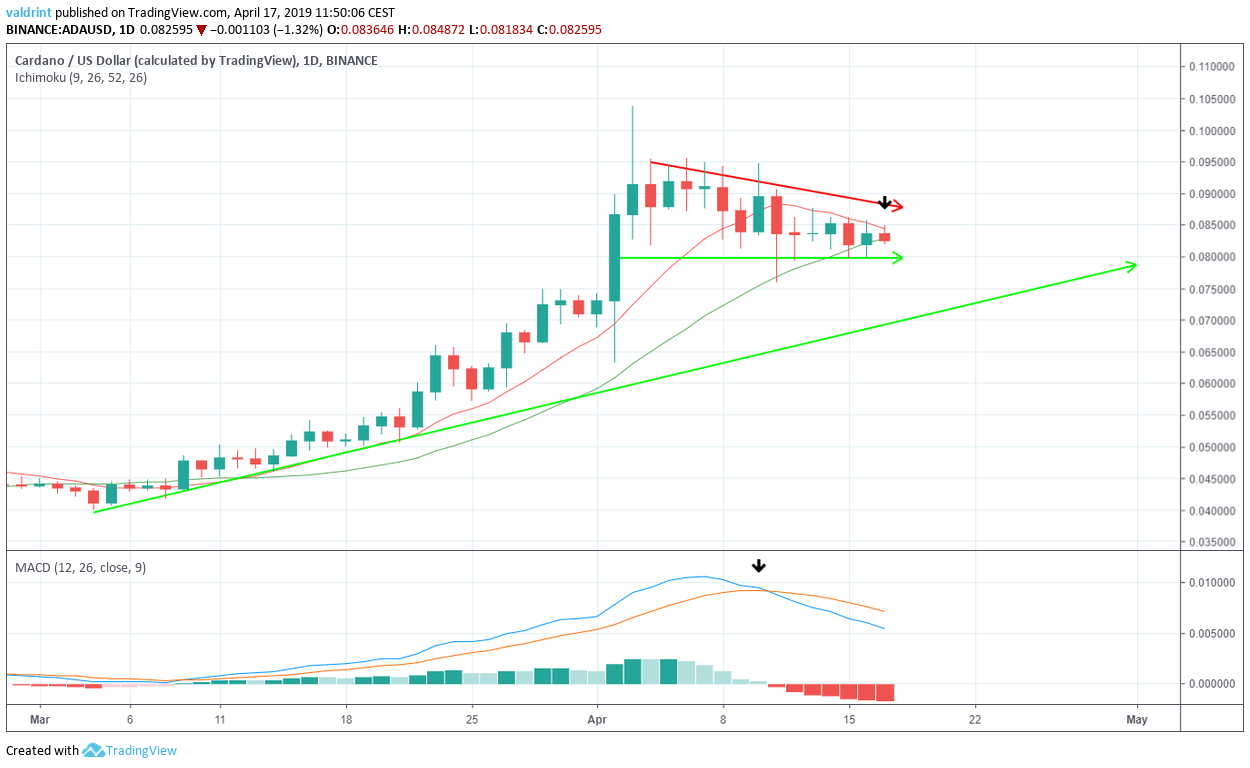
On Apr 17, the price of ADA moved below the 10- and 20-day moving averages.
Furthermore, the 10-day MA is in the process of crossing below the 20-day MA.
This is known as a bearish cross and may indicate that the current trend may be over.
Similarly, the MACD made a bearish cross on Apr 9.
Finally, we can see that the price has been following an ascending support line since Mar 3.
The use of these indicators suggests that price decreases towards the ascending support line are to be expected. Price decreases along a downtrend could be expected in the near future.
Sponsored SponsoredFuture Movements
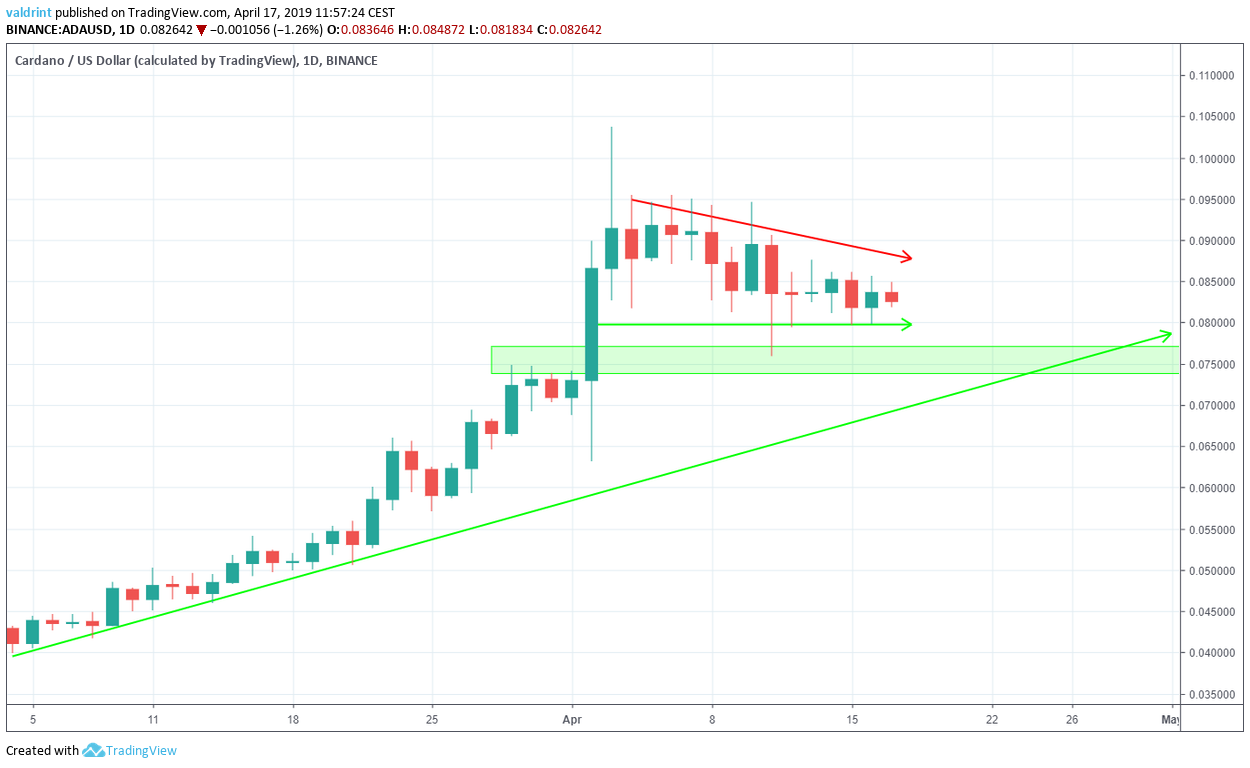
The closest support area is found near $0.075 and coinciding with the ascending support line. We believe that the price will eventually reach this area.
Summary of Analysis
Sponsored SponsoredBased on our analysis, the price of ADA will likely break down from the triangle and decrease towards the support area of $0.075.
Do you think the price of ADA will eventually break down from the triangle? Let us know in the comments below.
To learn more about Cardano click on the button below. We’ve even included price predictions for 2019 and 2020!
Disclaimer: This article is not trading advice and should not be construed as such. Always consult a trained financial professional before investing in cryptocurrencies, as the market is particularly volatile.
